Use Case of this extension
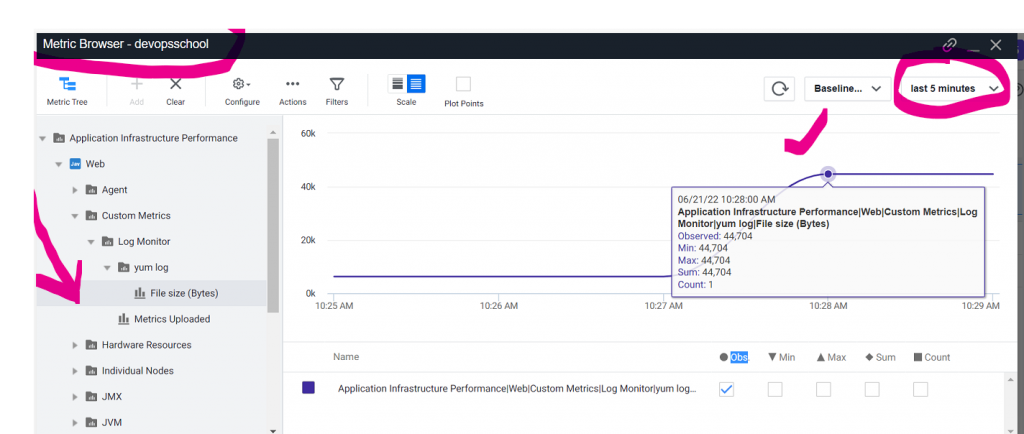
The AppDynamics Log Monitoring Extension monitors the occurrences of configured text or regular expressions in a set of log files, and the sizes of these files
Log Data collection begins with AppDynamics Agents and the Controller. Agents are plug-ins or extensions sitting across your entire application ecosystem that monitor the performance of your application code, runtime, and behavior. The Controllers receive real time performance data from the agents, visualize your application performance, and send instructions to the agents.
Log file monitoring extension can only be used if you have a machine agent running on your server.
You should be able to use that extension to count the occurences of Error, Warn or any other pattern in your log files.
Output

Reference
- https://developer.cisco.com/codeexchange/github/repo/Appdynamics/log-monitoring-extension
- https://developer.cisco.com/codeexchange/github/repo/Appdynamics/WindowsEventMonitorExtension
- https://github.com/Appdynamics/log-monitoring-extension
- https://appd-serverless.awsworkshop.io/
- https://medium.com/@nidhi2505/log-analytics-with-appdynamics-d38c2eacb636
- How do I build and place an extension?
- How do I configure an extension?
- What do I need to know about the Machine Agent restart?
- Where do I look for custom metrics?
- Additional troubleshooting resources
I’m a DevOps/SRE/DevSecOps/Cloud Expert passionate about sharing knowledge and experiences. I am working at Cotocus. I blog tech insights at DevOps School, travel stories at Holiday Landmark, stock market tips at Stocks Mantra, health and fitness guidance at My Medic Plus, product reviews at I reviewed , and SEO strategies at Wizbrand.
Please find my social handles as below;
Rajesh Kumar Personal Website
Rajesh Kumar at YOUTUBE
Rajesh Kumar at INSTAGRAM
Rajesh Kumar at X
Rajesh Kumar at FACEBOOK
Rajesh Kumar at LINKEDIN
Rajesh Kumar at PINTEREST
Rajesh Kumar at QUORA
Rajesh Kumar at WIZBRAND

 Starting: 1st of Every Month
  +91 8409492687
  Contact@DevOpsSchool.com
