This Integration collects metrics and logs from Docker containers. The default data streams for metrics collection are: container, cpu, diskio, healthcheck, info, memory and network. The image metricset is not enabled by default. The container_logs data stream for containers’ logs collection is enabled by default.
Compatibility
The Docker module is currently tested on Linux and Mac with the community edition engine, versions 1.11 and 17.09.0-ce. It is not tested on Windows, but it should also work there.
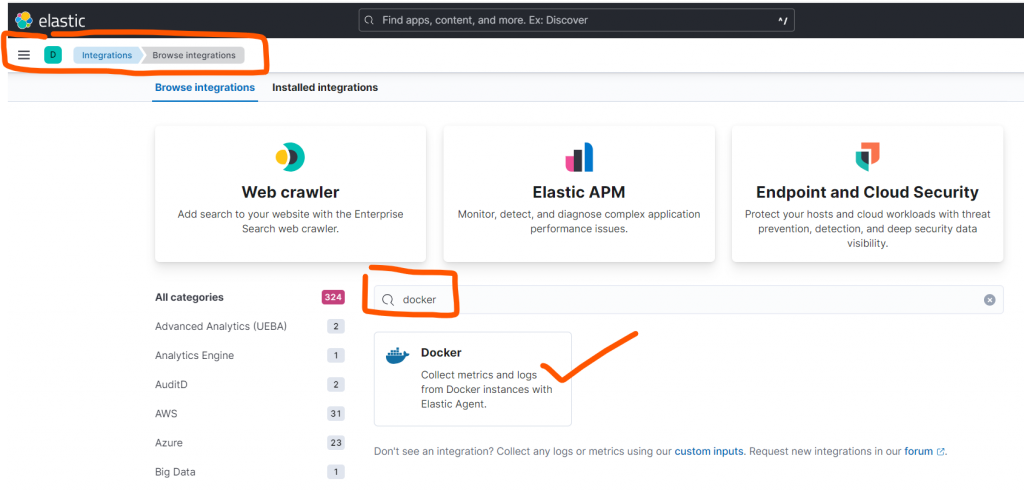
Step 1 – Install Docker
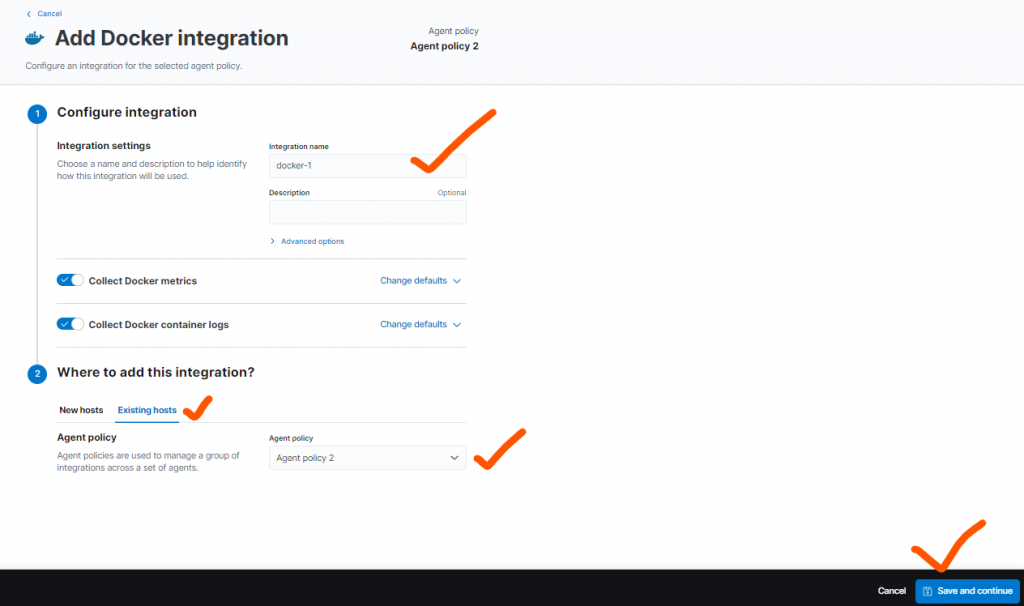
Step 2 – Enable Integration


Step 3 – Work on Agent Configuration changes
$ cd /opt/Elastic/Agent
$ systemctl stop elastic-agent
# Replace the content of elastic-agent.yml which you recieved from Kibana.
$ vi elastic-agent.yml
$ systemctl restart elastic-agent
$ systemctl status elastic-agent
Step 4 – Create docker containers
$ docker run -itd ubuntu
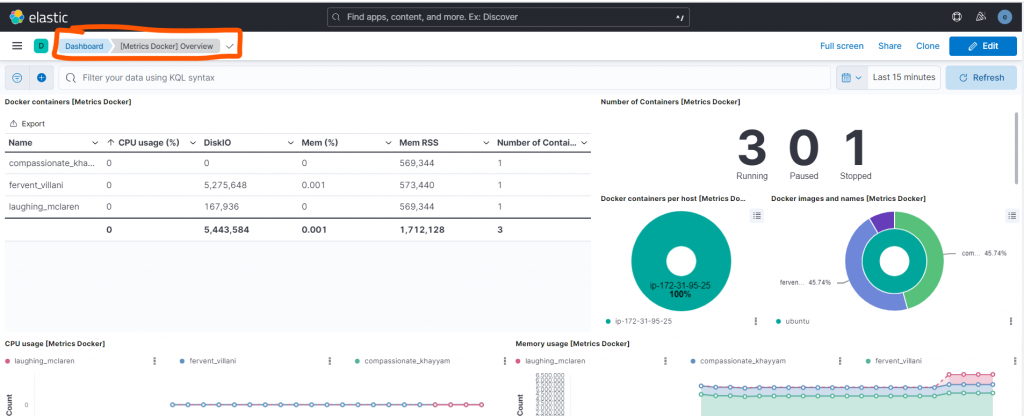
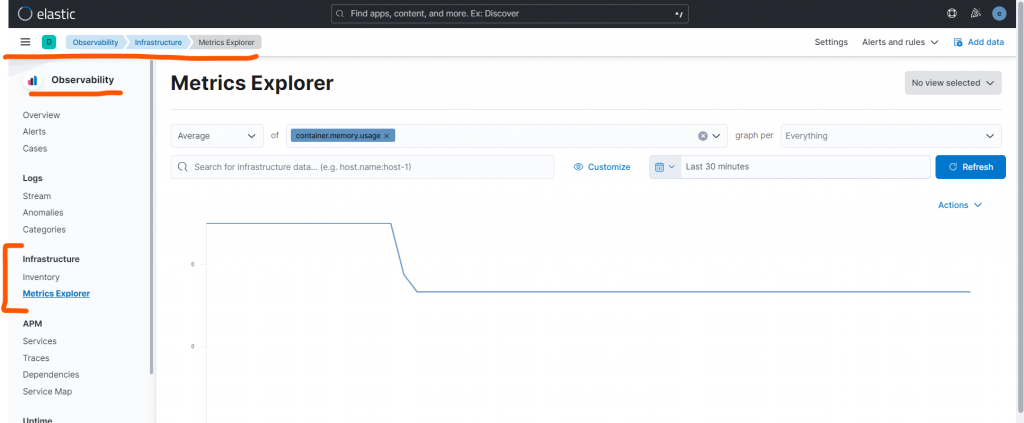
Step 5 – Verify Containers


Running from within Docker
The docker Integration will try to connect to the docker socket, by default at unix:///var/run/docker.sock. If Elastic Agent is running inside docker, you'll need to mount the unix socket inside the container:

docker run -d \
  --name=metricbeat \
  --user=root \
  --volume="/var/run/docker.sock:/var/run/docker.sock:ro" \
  docker.elastic.co/beats/metricbeat:latest metricbeat -e \
  -E output.elasticsearch.hosts=["elasticsearch:9200"]

For log collection since the discovery of the containers happen automatically, again access to unix:///var/run/docker.sock will be needed so as Agent to be able to watch for Container events. In addition, access is required to the containers' logs files which by default follows the pattern of /var/lib/docker/containers/${docker.container.id}/*-json.log If Elastic Agent is running inside docker, you'll need to mount the logs' directory too inside the container:

docker run -d \
  --name=metricbeat \
  --user=root \
  --volume="/var/run/docker.sock:/var/run/docker.sock:ro" \
  --volume="/var/lib/docker/containers:/var/lib/docker/containers:ro" \
  docker.elastic.co/beats/metricbeat:latest metricbeat -e \
  -E output.elasticsearch.hosts=["elasticsearch:9200"]

In all cases make sure that Agent has the proper permissions to access these files.I’m a DevOps/SRE/DevSecOps/Cloud Expert passionate about sharing knowledge and experiences. I am working at Cotocus. I blog tech insights at DevOps School, travel stories at Holiday Landmark, stock market tips at Stocks Mantra, health and fitness guidance at My Medic Plus, product reviews at I reviewed , and SEO strategies at Wizbrand.
Please find my social handles as below;
Rajesh Kumar Personal Website
Rajesh Kumar at YOUTUBE
Rajesh Kumar at INSTAGRAM
Rajesh Kumar at X
Rajesh Kumar at FACEBOOK
Rajesh Kumar at LINKEDIN
Rajesh Kumar at PINTEREST
Rajesh Kumar at QUORA
Rajesh Kumar at WIZBRAND

 Starting: 1st of Every Month
  +91 8409492687
  Contact@DevOpsSchool.com
