There are numerous data analytics tools available in the market that cater to different aspects of data analysis. We’ve compiled a list of the top data analytics tools that you can use to turn your data into insights.
Tableau:
Tableau is a powerful and widely used data visualization and business intelligence tool that helps users analyze and present data in a visually appealing manner.
Tableau is a business intelligence (BI) and data visualization software. It helps businesses explore and analyze their data to gain insights and make better decisions. Tableau is a powerful tool that can be used for a variety of purposes, including:
- Marketing: Tableau can be used to track marketing campaigns, analyze customer behavior, and identify trends.
- Sales: Tableau can be used to track sales performance, identify leads, and forecast future sales.
- Human resources: Tableau can be used to track employee turnover, analyze employee satisfaction, and identify training needs.
- IT: Tableau can be used to track IT assets, analyze IT performance, and identify security risks.
- Finance: Tableau can be used to track financial performance, analyze budgets, and identify cost savings opportunities.
Tableau is a versatile tool that can be used for a variety of purposes. It is easy to use and can be used by people with no prior experience in data visualization. Tableau also offers a variety of features that make it a powerful tool for exploring and analyzing data.
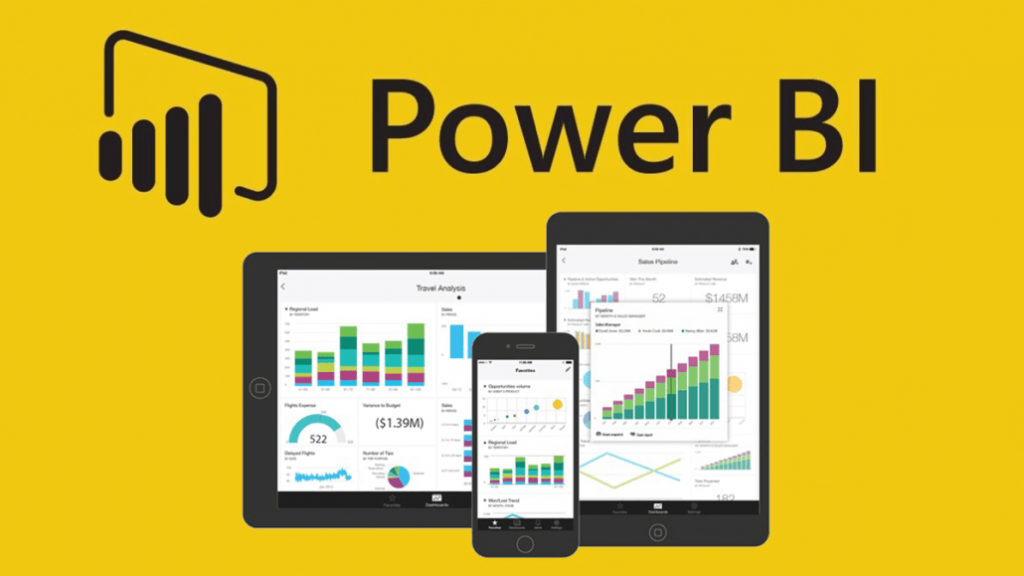
Power BI:
Power BI, developed by Microsoft, is another popular business analytics and data visualization tool. It allows users to connect to various data sources, create interactive dashboards, and generate insights.

Python:
Python is a versatile programming language with numerous libraries and frameworks for data analysis. Some popular libraries include NumPy, Pandas, Matplotlib, and SciPy.
R:
R is a programming language specifically designed for statistical analysis and graphical representation of data. It has a wide range of packages for data manipulation, modeling, and visualization.
SAS:
SAS (Statistical Analysis System) is a software suite that provides advanced analytics, business intelligence, and data management capabilities. It offers a comprehensive set of tools for data mining, forecasting, and statistical analysis.
Apache Hadoop:
Apache Hadoop is an open-source framework that allows distributed processing of large datasets across clusters of computers. It provides a scalable and cost-effective solution for big data analytics.
Apache Spark:
Apache Spark is a fast and general-purpose cluster computing system that provides in-memory processing capabilities. It is commonly used for big data processing, machine learning, and real-time analytics.
Excel:
Microsoft Excel is a widely used spreadsheet application that also offers basic data analysis functionalities. It includes features like pivot tables, data filtering, and built-in formulas for performing calculations on data.

MATLAB:
MATLAB is a programming environment designed for numerical computing and data analysis. It provides a wide range of tools and functions for statistical analysis, data visualization, and machine learning.
KNIME:
KNIME (Konstanz Information Miner) is an open-source data analytics platform that allows users to visually create data workflows. It supports a wide range of data manipulation, transformation, and modeling techniques.
RapidMiner:
RapidMiner is a data science platform that offers a visual interface for building and deploying data analytics models. It provides a comprehensive set of tools for data preprocessing, modeling, and evaluation.
QlikView:
QlikView is a business intelligence and data visualization tool that enables users to create interactive dashboards and perform ad-hoc data analysis.
Google Analytics:
Google Analytics is a web analytics tool that tracks and reports website traffic and user behavior. It provides valuable insights into visitor demographics, traffic sources, and user engagement.

Apache Flink:
Apache Flink is a stream processing framework that enables real-time data analytics on large-scale datasets. It supports event-driven and batch processing, making it suitable for real-time analytics applications.
IBM Watson Analytics:
IBM Watson Analytics is a cloud-based analytics platform that utilizes artificial intelligence and natural language processing to analyze data. It offers features like data exploration, predictive modeling, and data storytelling.
Please note that this list is not exhaustive, and there are many other data analytics tools available, each with its own strengths and specialties. The choice of tool depends on the specific requirements, data volume, complexity, and the skill set of the users.
Email- contact@devopsschool.com

 Starting: 1st of Every Month
  +91 8409492687
  Contact@DevOpsSchool.com
