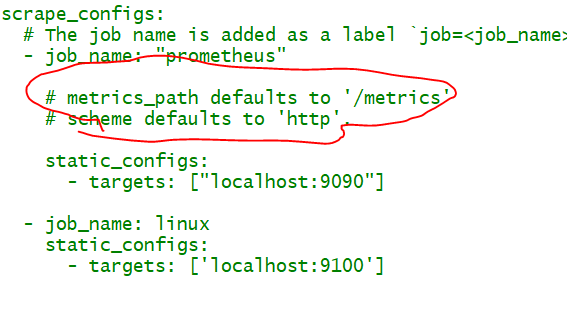
FAQ# 1- How to add https url to scrap on target prometheus?

Example 1
Use the following configuration:

  - job_name: 'domain-job'
    scheme: https
    static_configs:
    - targets: ['myDomain.dev']
Example 2
Add a new job that configures both a custom metrics path and scheme.

It would look something like this:

- job_name: new-job
  scrape_interval: 5s
  static_configs:
    - targets: ['www2.abc.abc.com:443']

  metrics_path: /servlet/metrics/
  scheme: https

Port 443 is the HTTPS port, scheme: https makes sure the HTTPS protocol is uses and metrics_path points to your custom path with the metrics handler.
FAQ# 2- How to setup High available Prometheus multi node clustor for Storage?
Prometheus includes a local on-disk time series database, but also optionally integrates with remote storage systems.
Prometheus’s local storage is limited to a single node’s scalability and durability. Instead of trying to solve clustered storage in Prometheus itself, Prometheus offers a set of interfaces that allow integrating with remote storage systems.
But, There are some solution available to for Highly available Prometheus multi node clustor
Federation
Federation allows a Prometheus server to scrape selected time series from another Prometheus server. There are different use cases for federation. Commonly, it is used to either achieve scalable Prometheus monitoring setups or to pull related metrics from one service’s Prometheus into another.
- https://prometheus.io/docs/prometheus/latest/federation/
Thanos
Open source, highly available Prometheus setup with long term storage capabilities.
Thanos is a monitoring system that aggregates data from multiple Prometheus deployments. This data can then be inspected and analyzed using Grafana, just as with regular Prometheus metrics. Although this setup sounds complex, it’s actually very easy to achieve with the Bitnami Helm charts:
- https://thanos.io/
How to Enable Prometheus Lifecycle API “Lifecycle API is not enabled”?
Run prometheus with --web.enable-lifecycle

The POST to /-/reload method as above, but it requires the --web.enable_lifecycle flag to have been added to docker-compose.yml or the docker run command beforehand:

$ docker run -p 9090:9090 -v /path/to/prometheus.yml:/etc/prometheus/prometheus.yml prom/prometheus --web.enable-lifecycleI’m a DevOps/SRE/DevSecOps/Cloud Expert passionate about sharing knowledge and experiences. I am working at Cotocus. I blog tech insights at DevOps School, travel stories at Holiday Landmark, stock market tips at Stocks Mantra, health and fitness guidance at My Medic Plus, product reviews at I reviewed , and SEO strategies at Wizbrand.
Please find my social handles as below;
Rajesh Kumar Personal Website
Rajesh Kumar at YOUTUBE
Rajesh Kumar at INSTAGRAM
Rajesh Kumar at X
Rajesh Kumar at FACEBOOK
Rajesh Kumar at LINKEDIN
Rajesh Kumar at PINTEREST
Rajesh Kumar at QUORA
Rajesh Kumar at WIZBRAND

 Starting: 1st of Every Month
  +91 8409492687
  Contact@DevOpsSchool.com
