Introduction
With the use of technology the applications are becoming more and more complex and distributed nowadays therefore every business is highly dependent on software these days. Ensuring that all of your organization’s mission-critical applications are running optimally at all times is priority number 1! These solutions provide performance metrics for applications, with specific insights into the statistics such as the amount of transactions processed by the application or the response time to process such transactions. There is a wide range of application performance management and application monitoring tools on the market available for developers, DevOps teams, and traditional IT operations.
What is Application Performance Monitoring?
If a whole server becomes unresponsive, you need to know what kind of web activity caused it, and quickly. Application Performance Monitoring, or APM, gives you this visibility, and more.
Using application performance monitoring (APM) solutions, businesses can monitor whether their IT environment meets performance standards, identify bugs and potential issues, and provide flawless user experiences via close monitoring of IT resources.
It’s harder than ever to get visibility into the everyday workings of an application, which is why APM tools are an essential part of a development workflow.
Steps in full-featured approach to application performance management are as follows.
- End-User Experience Monitoring — As a first step, end-user experience monitoring would pick up a problem as it impacts the application’s user.
- Runtime Application Architecture Discovery, Modeling, and Display — As a second step, the application’s runtime architecture would be generated and/or surveyed to establish the potential scope of the problem.
- User-Defined Transaction Profiling — As a third step, user-defined transactions would be examined as they flow across some subset of the possible paths exhibited by the runtime architecture graph, to ascertain what nodes in that graph are the sources of the problem impacting the end user.
- Component Deep-Dive Monitoring in an Application Context — As a fourth step, deep-dive monitoring of those nodes is carried out in the context of the results of the previous three steps.
- IT Operations Analytics — As a fifth and final step, analytics are brought to bear—on the one hand, to establish root cause in the midst of the vast volumes of data generated in the first four steps, and, on the other hand, to better anticipate and prepare for end-user experience problems that could emerge in the future.
Why Application Performance Monitoring is important?
- Measure performance of every web request and transaction.
- Code level performance profiling.
- Usage and performance of all application dependencies like databases, web services, caching, etc
- Detailed traces of individual web requests or transactions.
- Basic server monitoring and metrics like CPU, memory, etc
- Application framework metrics like performance counters, JMX MBeans, etc
- Access to Application log data.
- Real User Monitoring (RUM)
Key thing while Selecting Application Monitoring Tools
- Programming language support
- Cloud support (Azure, AWS, Heroku, etc)
- SaaS vs On-premise
- Pricing
- Ease of use
Here, is a list of Top 5 Application Monitoring tools along with their key features
1. New Relic APM

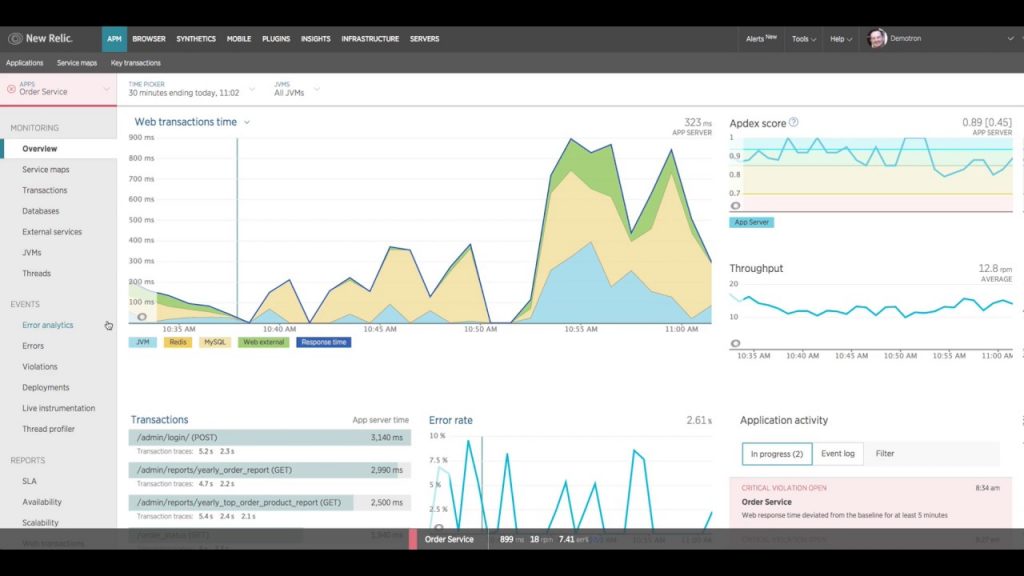
New Relic has championed the idea of a SaaS based APM and is one of the industry leaders in application performance management. New Relic also provides APM for mobile apps, advanced browser performance monitoring and most recently added infrastructure monitoring.
Features-
- Track SQL statements responsible for slow performance
- Offers performance trends at a glance
- Allows SQL Query Analysis
- Provide advanced alerts
- Code-level diagnostics
- Cross-Application Tracing
2.AppDynamics

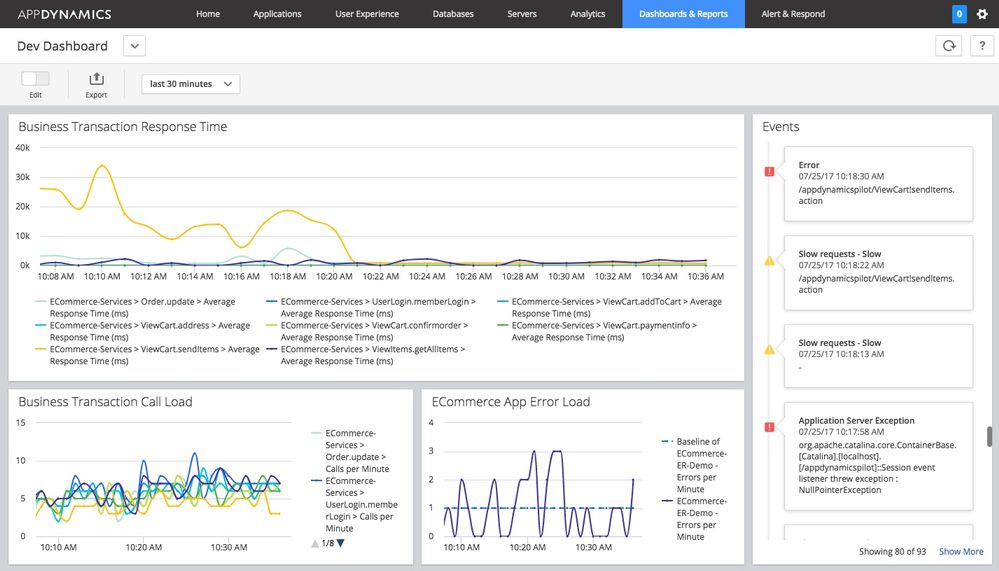
Appdymanic offers Saas as well as an on-premise option. This APM tool monitors application performance. It also drives insights into how application impact the performance of the business.
Features-
- Offers End-to-end transaction tracing
- Diagnose and eliminate problems at code-level
- Visualize your entire application stack
- Dynamic Baselining and Alerting
3. Datadog
Datadog is a performance monitoring solution which brings together metrics and events from applications, servers, tools, databases, to provide a unified view of the infrastructure.
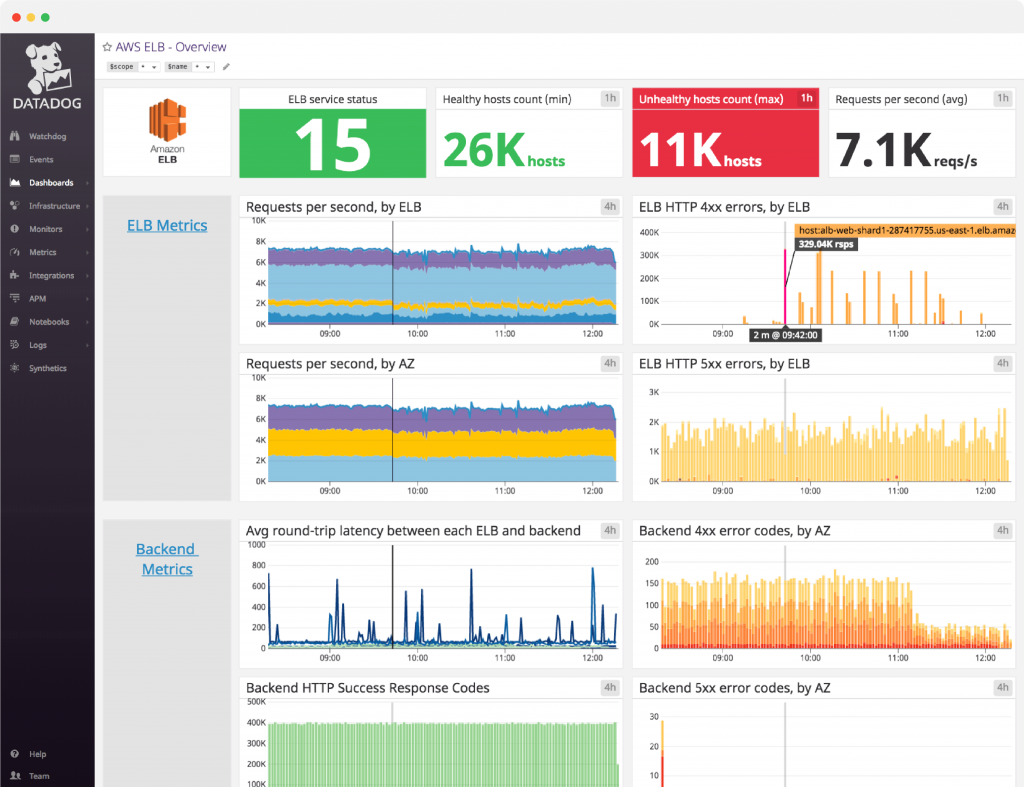
Features-
- View graphs across sources in real-time
- Easily customize views in code or interactively
- Overlay metrics and events across disparate sources
- Receive alerts on any metric
- Works seamlessly with your existing infrastructure
4. Dynatrace (Compuware APM)

DynaTrace, previously known as Compuware APM, is touted as the first self-learning Application Performance Monitoring Software. Through its agent is provides auto-discovered topology visualizations of applications and their components. This sets DynaTrace apart as an application performance tool.
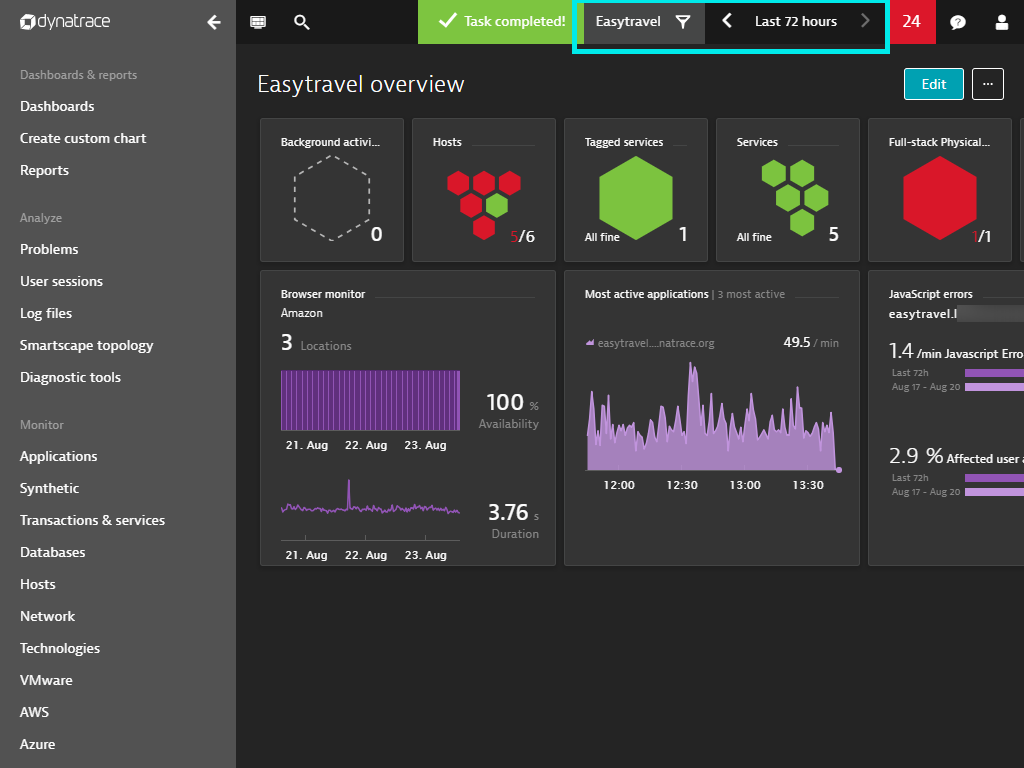
Features-
- Full stack discovery and performance management
- Visualizing application infrastructure
- Self-healing at scale
- Detecting vMotion events
- Digital experience management
5. Stackify Retrace

Stackify is a cloud base platform which offers software developers, operations and support managers with innovative APM solutions. It allows to monitor and troubleshoot cloud-based applications and get DevOps visibility.
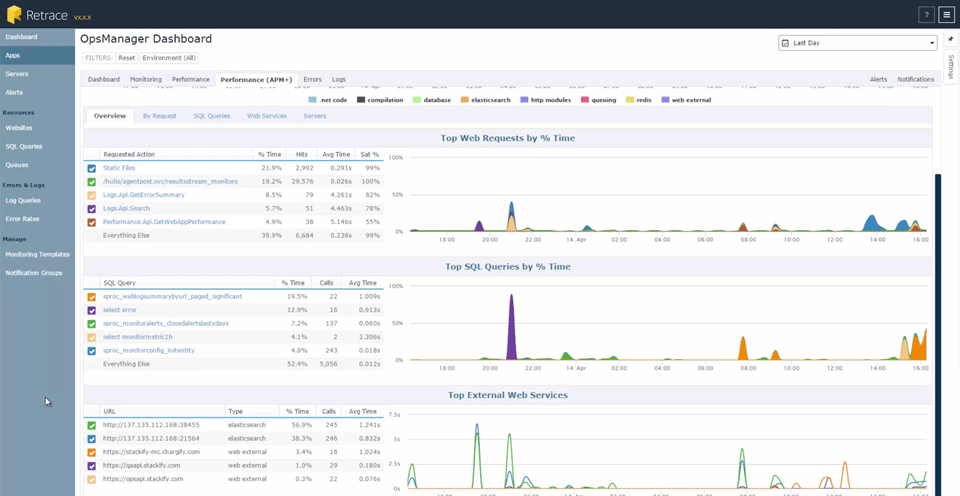
Features-
- SaaS-based
- Find bugs during development & QA
- Integrated errors & log management
- Troubleshoot production problems
- Optimized for developers
6. Elastic APM

Monitoring the performance of our applications is extremely important for constantly improving it and solving production issues fast.
Elastic Application Performance Management(APM) is a new feature available in Elasticsearch 6.1 (in beta and alpha in 6.0). The ELK stack provides something called as APM which is a part of the Kibana UI app to monitor our applications in realtime. This system has mainly 3 components
Kibana APM UI
APM Server
APM agent
The APM agent is a very small programming language specific module which can be installed in our app. This module monitors the state of the application and regularly sends the logs (transactions and errors) to the APM server.
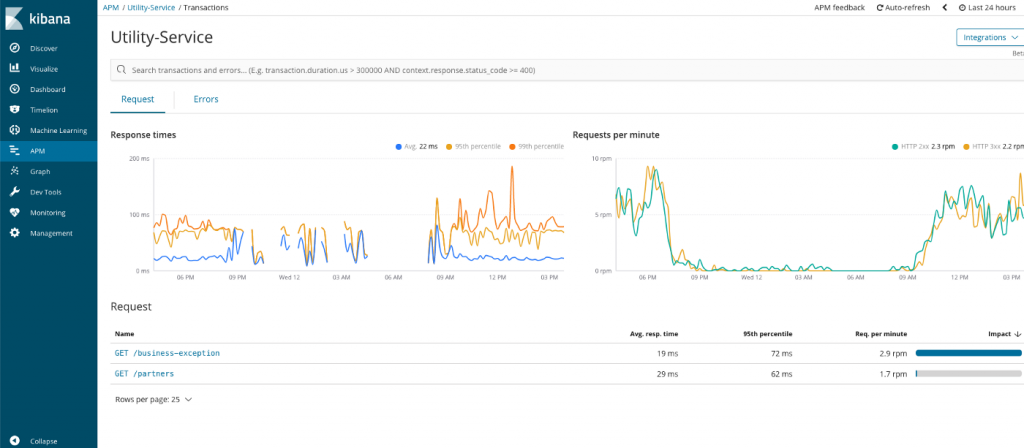
The APM server receives the logs from various applications and transforms them into structured data in JSON format. It then send these logs to Elasticsearch database which in turn indexes the JSON and persists it on disk.
The APM UI gives a lot of information about our application. It shows the request and response times of our API’s over time. It shows the runtime errors that are occurring in the application. It also shows exactly what is happening in the code.
7. SignalFx Microservices APM by Splunk

Splunk, a platform for searching, monitoring, and examining machine-generated big data, has launched a new release of application, monitoring tool SignalFx Microservices APM. The new release combines NoSample tracing, open standards-based instrumentation and artificial intelligence (AI)-driven directed troubleshooting from SignalFx and Omnition. It supports open source instrumentation, via either our auto-instrumentation agents and libraries or manual instrumentation, to capture data from a wide range of programming languages and environments.
SignalFx allows you to monitor hosts, containers, and applications from a single pane of glass. Metrics you can monitor include
System CPU Usage, Memory Usage, Memory Limit, Network Bytes Received, Block I/O Volume, Total Block I/O volume and more.
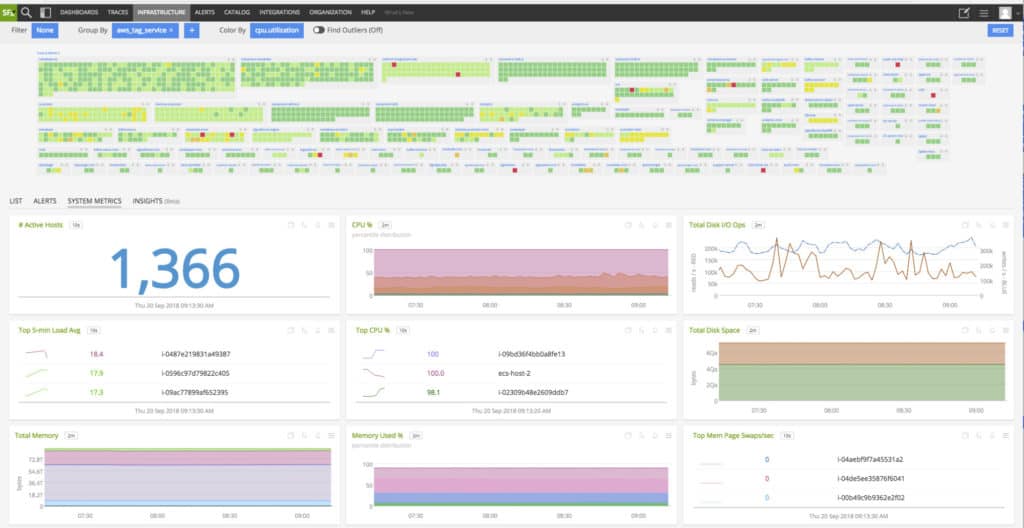
With the alerts system, you don’t have to catch everything in real-time. SignalFx’s alerts are almost instantaneous and notify you when something changes in your cloud environment.
Reference
– ManageEngine Applications Manager
– Site24x7
Conclusion
No matter what type of business you have, application performance management is an important task of the IT department. In online businesses, the applications offered to visitors are the only contact that customers get with the organization, so guaranteed application performance is essential.
With proper application management, you can prevent problems that cause users to make Help Desk calls. So, these software pays for itself because it will save your IT department time and money on customer support functions.
I’m a DevOps/SRE/DevSecOps/Cloud Expert passionate about sharing knowledge and experiences. I am working at Cotocus. I blog tech insights at DevOps School, travel stories at Holiday Landmark, stock market tips at Stocks Mantra, health and fitness guidance at My Medic Plus, product reviews at I reviewed , and SEO strategies at Wizbrand.
Do you want to learn Quantum Computing?
Please find my social handles as below;
Rajesh Kumar Personal Website
Rajesh Kumar at YOUTUBE
Rajesh Kumar at INSTAGRAM
Rajesh Kumar at X
Rajesh Kumar at FACEBOOK
Rajesh Kumar at LINKEDIN
Rajesh Kumar at PINTEREST
Rajesh Kumar at QUORA
Rajesh Kumar at WIZBRAND

 Starting: 1st of Every Month
  +91 8409492687
  Contact@DevOpsSchool.com
