Java Management Extensions (JMX) was introduced in J2SE 5.0 release.
It is a set of specifications used for network and application management. It specifies a method for developers to integrate the applications they are working on with their network management software by assigning Java objects with management attributes.
JMX gives developers a standard and simple way to manage resources, including services, devices, and applications. It is dynamic, making it possible to manage and monitor resources as soon as they are created, implemented or installed.
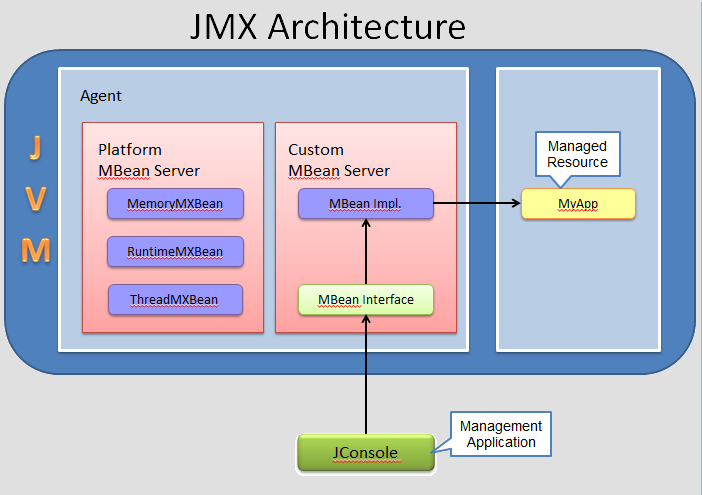
To manage any resource through JMX, we need to create Managed Beans (MBeans) and then register it to the MBean Server. MBean server works as a management agent for all the MBeans registered.
Benefits of using JMX are:
- JMX allows us to manage our application at runtime without any heavy investment and provides out of the box solution.
- Using JMX is easy and reduces effort and investment for creating any management tool for our applications.
JMX Architecture
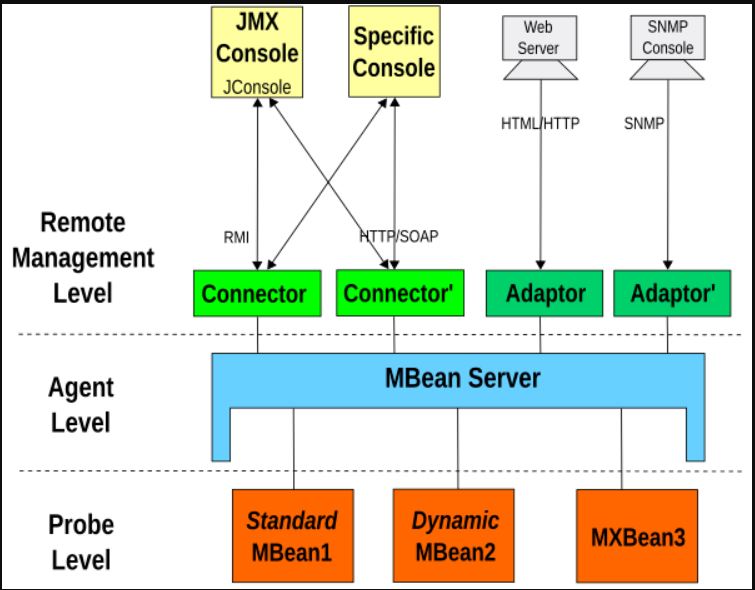
JMX architecture follows a three-layered approach:
- Instrumentation layer: MBeans registered with the JMX agent through which resources are managed
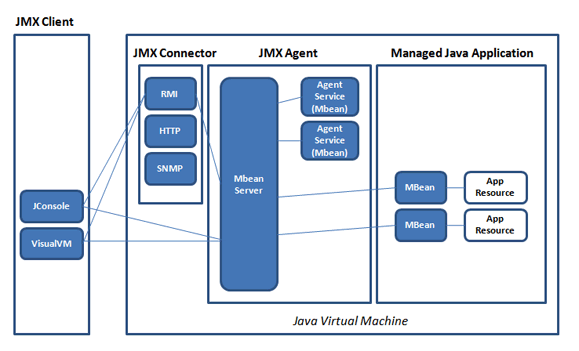
- JMX agent layer: the core component (MbeanServer) which maintains registry of managed MBeans and provides an interface to access them
- Remote management layer: usually client side tool like JConsole
What is mBean?
With Java Management Extensions technology, a resource is represented by Managed Beans or mBeans. These are registered on the mBean server, a core-managed object server that acts as an agent and can be used on a majority of devices that support Java.
In simpler terms, mBeans acts like Java wrappers for services, components, devices, or applications in a distributed network, while the mBean server provides the actual management, as it is where you would find all the manageable resources. This server then becomes the central focus of the architectural frame, which allows server components to plug in and find manageable objects.
A JMX agent, therefore, would consist of the mBean server, plus the services needed to handle the mBeans (you’ll also want an APM solution that includes application framework metrics like mBeans and performance counters).
Java Management Extensions specifies standard connectors, which are called JMX connectors. These connectors allow you to access the agents from your remote management applications. These connectors may use different protocols and still work with the same management interface
With JMX technology
- You can now manage Java applications on devices that you already have. What’s more, you do not have to change the design of your application and still be able to manage them easily. All your application needs to have is the managed object server, and as long as the mBeans are registered in the object server, you can use its functionality.
- You now have a standard means to manage your Java systems, networks and applications. For instance, your Java EE 5 application server is compatible with JMX and can be managed using JMX technology.
- You can also use it to manage Java VM. You can initiate a JMX agent to gain access to the instrumentation found in Java VM, at which point you can now remotely monitor or manage a Java virtual machine.
- You now have a dynamic and scalable management architecture. Each JMX agent service can be used with the management agent. This modularity means that the technologies can scale and can be used with smaller devices to huge telecommunication systems. Just as long as you have the core services identified by the specification, you can add services and load, unload, and update these dynamically.
Why Use the JMX Technology?
The JMX technology provides developers with a flexible means to instrument Java technology-based applications (Java applications), create smart agents, implement distributed management middleware and managers, and smoothly integrate these solutions into existing management and monitoring systems.
The JMX technology enables Java applications to be managed without heavy investment.
A JMX technology-based agent (JMX agent) can run on most Java technology-enabled devices. Consequently, Java applications can become manageable with little impact on their design. A Java application needs only to embed a managed object server and make some of its functionality available as one or several managed beans (MBeans) registered in the object server. That is all it takes to benefit from the management infrastructure.
The JMX technology provides a standard way to manage Java applications, systems, and networks.
For example, the Java Platform, Enterprise Edition (Java EE) 5 Application Server conforms to the JMX architecture and consequently can be managed by using JMX technology.
The JMX technology can be used for out-of-the-box management of the Java VM.
The Java Virtual Machine (Java VM) is highly instrumented using the JMX technology. You can start a JMX agent to access the built-in Java VM instrumentation, and thereby monitor and manage a Java VM remotely.
The JMX technology provides a scalable, dynamic management architecture.
Every JMX agent service is an independent module that can be plugged into the management agent, depending on the requirements. This component-based approach means that JMX solutions can scale from small-footprint devices to large telecommunications switches and beyond. The JMX specification provides a set of core agent services. Additional services can be developed and dynamically loaded, unloaded, or updated in the management infrastructure.
The JMX technology leverages existing standard Java technologies.
Whenever needed, the JMX specification references existing Java specifications, for example, the Java Naming and Directory Interface (J.N.D.I.) API.
The JMX technology-based applications (JMX applications) can be created from a NetBeans IDE module.
You can obtain a module from the NetBeans Update Center (select Tools -> Update Center in the NetBeans interface) that enables you to create JMX applications by using the NetBeans IDE. This reduces the cost of development of JMX applications.
The JMX technology integrates with existing management solutions and emerging technologies.
The JMX APIs are open interfaces that any management system vendor can implement. JMX solutions can use lookup and discovery services and protocols such as Jini network technology and the Service Location Protocol (SLP).
What is JConsole?
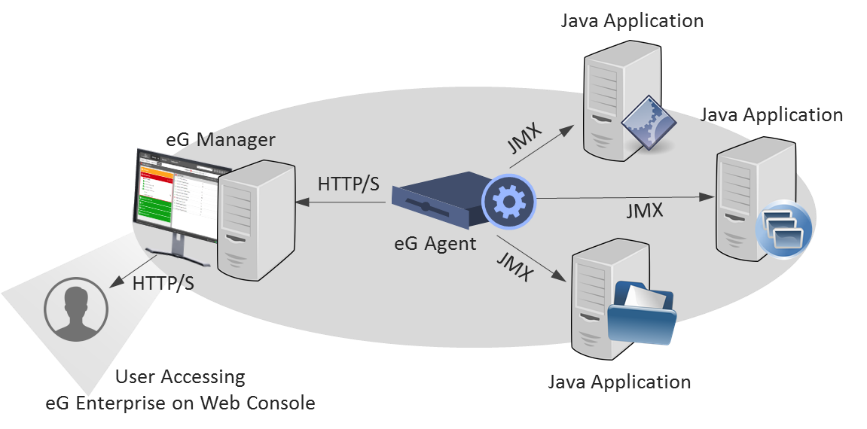
JConsole is a monitoring tool for Java Management Extensions. It uses a wide array of JMX instrumentation and gives you data on resource consumption as well as the performance of Java applications. You can start JConsole by running the JConsole executable, which you can find on the JDK_HOME/bin directory. You can use JConsole for monitoring local and remote applications.
What is JMX Console?
JMX Console is the management console used by JBoss. It gives you a raw view of all the mBeans that the JBoss server has. The console gives you information on the running server, how to modify its setup, as well as stop or start components, among other tasks. Note that JBoss is a middleware that is provided by Red Hat Inc., and is open source. You can, however, subscribe to JBoss to help you build your expertise, get support when necessary, and deploy without having to go through the complexities of deploying open source software.
Monitoring and Management Using JMX Technology
The Java virtual machine (Java VM) has built-in instrumentation that enables you to monitor and manage it using the Java Management Extensions (JMX) technology. These built-in management utilities are often referred to as out-of-the-box management tools for the Java VM. You can also monitor any appropriately instrumented applications using the JMX API.
Enabling the Out-of-the-Box Management. To monitor a Java platform using the JMX API, you must do the following.
- Enable the JMX agent (another name for the platform MBean server) when you start the Java VM. You can enable the JMX agent for:
— Local monitoring, for a client management application running on the local system.
— Remote monitoring, for a client management application running on a remote system. - Monitor the Java VM with a tool that complies to the JMX specification, such as JConsole.
Enable JMX Local Monitoring and Management
Under previous releases of the Java SE platform, to allow the JMX client access to a local Java VM, you had to set the following system property when you started the Java VM or Java application.
com.sun.management.jmxremote
Setting this property registered the Java VM platform’s MBeans and published the Remote Method Invocation (RMI) connector via a private interface to allow JMX client applications to monitor a local Java platform, that is, a Java VM running on the same machine as the JMX client.
For example, previously, to enable the JMX agent for the Java SE sample application Notepad, you would have to run the following commands.
% cd JDK_HOME/demo/jfc/Notepad
% java -Dcom.sun.management.jmxremote -jar Notepad.jar
Remote Monitoring and Management
To enable monitoring and management from remote systems, you must set the following system property when you start the Java VM.
com.sun.management.jmxremote.port=portNum
In the property above, portNum is the port number through which you want to enable JMX RMI connections. Be sure to specify an unused port number. In addition to publishing an RMI connector for local access, setting this property publishes an additional RMI connector in a private read-only registry at the specified port using a well known name, “jmxrmi”.
Reference
- https://docs.oracle.com/javase/8/docs/technotes/guides/management/agent.html
- https://www.journaldev.com/1352/what-is-jmx-mbean-jconsole-tutorial
How to register Application to MBean Server?
Step 1 – First of all we need to create MBean and for that we need to first create the interface that defines the attributes and operations that we want to expose. The interface name must end with MBean. If you just want to allow read-only, you can leave setter methods.
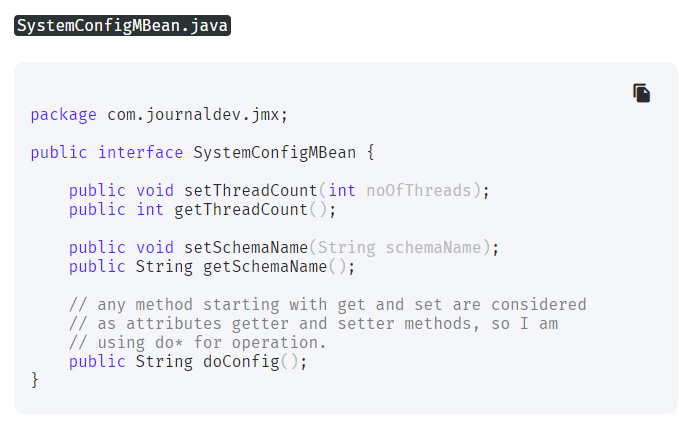
Step 2 – Next step is to provide the actual implementation of the MBean interface. The JMX Naming convention is to keep the implementation class name as interface name – MBean. So my implementation class will be
package com.journaldev.jmx;

public class SystemConfig implements SystemConfigMBean {

    private int threadCount;
    private String schemaName;

    public SystemConfig(int numThreads, String schema){
        this.threadCount=numThreads;
        this.schemaName=schema;
    }

    @Override
    public void setThreadCount(int noOfThreads) {
        this.threadCount=noOfThreads;
    }


    @Override
    public int getThreadCount() {
        return this.threadCount;
    }


    @Override
    public void setSchemaName(String schemaName) {
        this.schemaName=schemaName;
    }


    @Override
    public String getSchemaName() {
        return this.schemaName;
    }

    @Override
    public String doConfig(){
        return "No of Threads="+this.threadCount+" and DB Schema Name="+this.schemaName;
    }

}
Code language: JavaScript (javascript)
Step 3 – Now we need to register our MBean implementation to the MBean server. We can keep any name of our class. After registering MBean, I will keep the thread running until we modify the thread count to 0 through jconsole, that will be the logic to end our application.
package com.journaldev.jmx;

import java.lang.management.ManagementFactory;

import javax.management.InstanceAlreadyExistsException;
import javax.management.MBeanRegistrationException;
import javax.management.MBeanServer;
import javax.management.MalformedObjectNameException;
import javax.management.NotCompliantMBeanException;
import javax.management.ObjectName;

public class SystemConfigManagement {
    private static final int DEFAULT_NO_THREADS=10;
    private static final String DEFAULT_SCHEMA="default";

    public static void main(String[] args) throws MalformedObjectNameException, InterruptedException, InstanceAlreadyExistsException, MBeanRegistrationException, NotCompliantMBeanException {
        //Get the MBean server
        MBeanServer mbs = ManagementFactory.getPlatformMBeanServer();
        //register the MBean
        SystemConfig mBean = new SystemConfig(DEFAULT_NO_THREADS, DEFAULT_SCHEMA);
        ObjectName name = new ObjectName("com.journaldev.jmx:type=SystemConfig");
        mbs.registerMBean(mBean, name);
        do{
            Thread.sleep(3000);
            System.out.println("Thread Count="+mBean.getThreadCount()+":::Schema Name="+mBean.getSchemaName());
        }while(mBean.getThreadCount() !=0);

    }

}
Code language: JavaScript (javascript)
Step 4 – When I run the above program, it registers our MBean implementation to the platform MBean server and keeps on printing following lines on console.
I’m a DevOps/SRE/DevSecOps/Cloud Expert passionate about sharing knowledge and experiences. I am working at Cotocus. I blog tech insights at DevOps School, travel stories at Holiday Landmark, stock market tips at Stocks Mantra, health and fitness guidance at My Medic Plus, product reviews at I reviewed , and SEO strategies at Wizbrand.
Do you want to learn Quantum Computing?
Please find my social handles as below;
Rajesh Kumar Personal Website
Rajesh Kumar at YOUTUBE
Rajesh Kumar at INSTAGRAM
Rajesh Kumar at X
Rajesh Kumar at FACEBOOK
Rajesh Kumar at LINKEDIN
Rajesh Kumar at PINTEREST
Rajesh Kumar at QUORA
Rajesh Kumar at WIZBRAND

