Metrics Server is a scalable, efficient source of container resource metrics for Kubernetes built-in autoscaling pipelines.
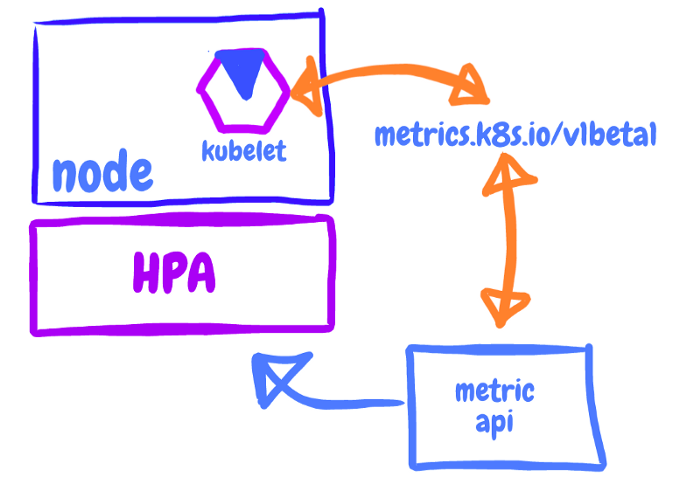
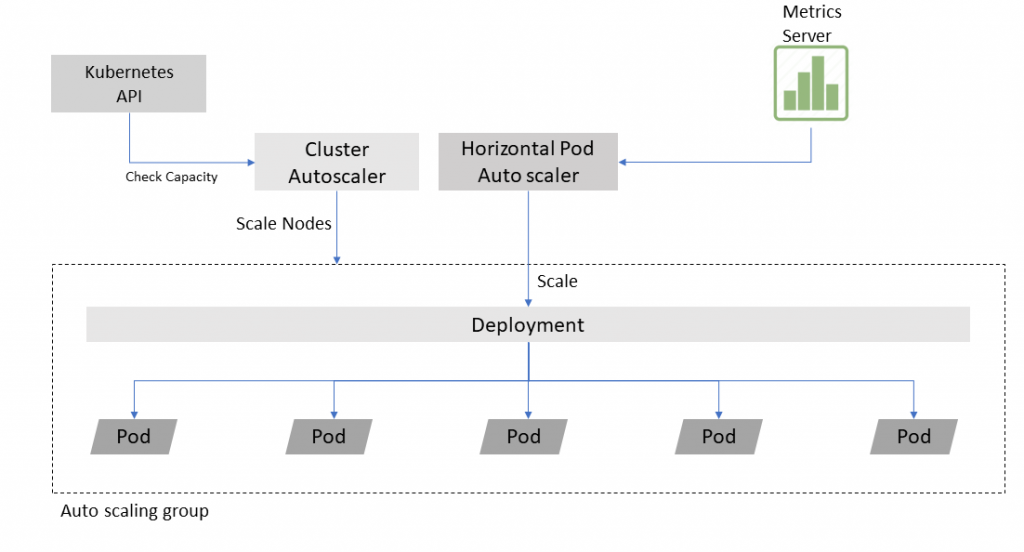
Metrics Server collects resource metrics from Kubelets and exposes them in Kubernetes apiserver through Metrics API for use by Horizontal Pod Autoscaler and Vertical Pod Autoscaler. Metrics API can also be accessed by kubectl top, making it easier to debug autoscaling pipelines.
Metrics Server is not meant for non-autoscaling purposes. For example, don’t use it to forward metrics to monitoring solutions, or as a source of monitoring solution metrics.


Metrics Server offers:
- A single deployment that works on most clusters
- Scalable support up to 5,000 node clusters
- Resource efficiency: Metrics Server uses 0.5m core of CPU and 4 MB of memory per node\
The way it works is relatively simple:
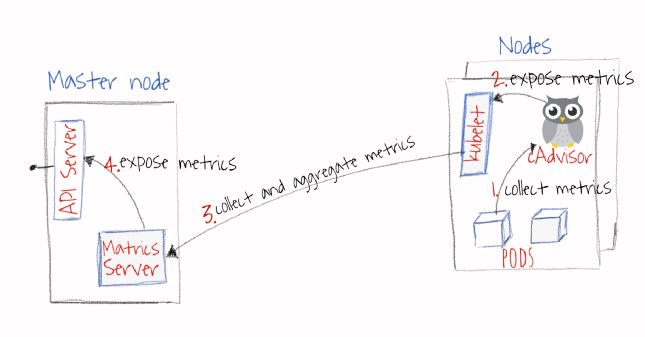
- CAdvisor collects metrics about containers and nodes that on which it is installed. Note: CAdvisor is installed by default on all cluster nodes
- Kubelet exposes these metrics (default is one-minute resolution) through Kubelet APIs.
- Metrics Server discovers all available nodes and calls Kubelet API to get containers and nodes resources usage.
- Metrics Server exposes these metrics through Kubernetes aggregation API.

How to install it?
| curl -L https://github.com/kubernetes-sigs/metrics-server/releases/download/v0.3.6/components.yaml --output components.yaml | |
| Update the change components.yaml | |
| # - /metrics-server | |
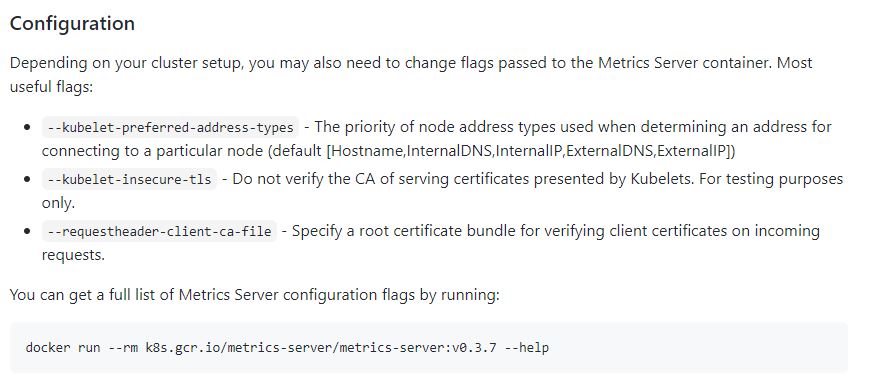
| - --kubelet-insecure-tls | |
| - --kubelet-preferred-address-types=InternalIP | |
| kubectl apply -f https://github.com/kubernetes-sigs/metrics-server/releases/download/v0.3.7/components.yaml --output components.yaml | |
| Update the change components.yaml | |
| # - /metrics-server | |
| - --kubelet-insecure-tls | |
| - --kubelet-preferred-address-types=InternalIP | |
| Verify | |
| $ kubectl top pod <pod-name> |

Refernece
I’m a DevOps/SRE/DevSecOps/Cloud Expert passionate about sharing knowledge and experiences. I am working at Cotocus. I blog tech insights at DevOps School, travel stories at Holiday Landmark, stock market tips at Stocks Mantra, health and fitness guidance at My Medic Plus, product reviews at I reviewed , and SEO strategies at Wizbrand.
Please find my social handles as below;
Rajesh Kumar Personal Website
Rajesh Kumar at YOUTUBE
Rajesh Kumar at INSTAGRAM
Rajesh Kumar at X
Rajesh Kumar at FACEBOOK
Rajesh Kumar at LINKEDIN
Rajesh Kumar at PINTEREST
Rajesh Kumar at QUORA
Rajesh Kumar at WIZBRAND

 Starting: 1st of Every Month
  +91 8409492687
  Contact@DevOpsSchool.com
 by
by 