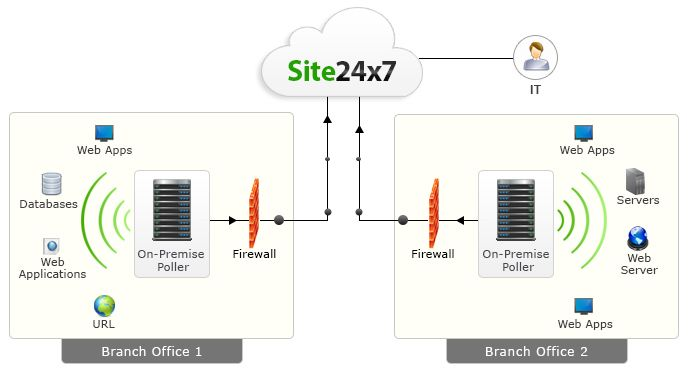
What is Site24x7?

Site24x7 is a comprehensive IT infrastructure monitoring and management platform that caters to a wide range of needs, from website and server monitoring to application performance monitoring and cloud cost optimization. It offers a unified dashboard, powerful analytics, and automated actions to help you maintain a healthy and performant IT ecosystem.
Top 10 use cases of Site24x7?
Here are the top 10 use cases of Site24x7:
1. Website Monitoring:
- Monitor website uptime and performance from multiple global locations.
- Track page load times, resource usage, and user experience metrics.
- Identify and troubleshoot web performance bottlenecks.
- Receive instant alerts for downtime and performance issues.
2. Server Monitoring:
- Monitor health and performance of physical and virtual servers.
- Track CPU, memory, disk, and network utilization.
- Receive alerts for critical metrics exceeding thresholds.
- Automate remediation actions like server restarts or scaling.
3. Application Performance Monitoring (APM):
- Monitor the performance of web applications and APIs.
- Track transaction times, errors, and resource consumption.
- Identify application bottlenecks and code-level issues.
- Gain insights into user experience across different platforms.
4. Cloud Monitoring:
- Monitor performance and costs of AWS, Azure, GCP, and other cloud services.
- Track resource utilization, service health, and billing metrics.
- Optimize cloud resource usage and reduce costs.
- Receive alerts for cloud service disruptions and cost anomalies.
5. Network Monitoring:
- Monitor network devices like routers, switches, and firewalls.
- Track network traffic, bandwidth utilization, and device health.
- Identify network bottlenecks and connectivity issues.
- Ensure network uptime and performance.
6. Log Management:
- Collect and analyze logs from applications, servers, and network devices.
- Correlate logs to identify root causes of issues.
- Generate reports and visualize log data.
- Comply with security and auditing requirements.
7. Real User Monitoring (RUM):
- Monitor real user experience of your website and applications.
- Track page load times, transaction times, and user actions.
- Identify slow-loading pages and problematic elements.
- Improve user experience and conversion rates.
8. Synthetic Monitoring:
- Simulate user interactions with your website and applications.
- Proactively recognise performance issues before they impact real users.
- Automate performance testing and ensure consistent user experience.
9. IT Automation:
- Automate IT tasks and workflows based on monitoring data.
- Trigger actions like server restarts, alerts, and ticket creation.
- Reduce manual work and improve incident response times.
10. Mobile App Monitoring:
- Monitor performance and user experience of mobile apps.
- Track app crashes, errors, and network usage.
- Identify app performance bottlenecks and user pain points.
- Improve app quality and user engagement.
These are just a few examples of how Site24x7 can be used to optimize your IT infrastructure and business operations. Its flexibility and extensive set of features make it a valuable tool for businesses of all sizes, from small startups to large enterprises.
What are the feature of Site24x7?
Site24x7 boasts a robust feature set catering to various IT infrastructure monitoring and management needs. Following is a breakdown of some key highlights:
Monitoring Capabilities:
- Website Monitoring: Monitor uptime, performance, and user experience from over 130 global locations. Track page load times, resource usage, and web vitals.
- Server Monitoring: Keep tabs on physical and virtual servers, tracking CPU, memory, disk, and network utilization. Receive alerts for critical metric breaches.
- Application Performance Monitoring (APM): Gain insights into web application and API performance. Track transaction times, errors, and resource consumption. Identify code-level issues.
- Cloud Monitoring: Monitor AWS, Azure, GCP, and other cloud services. Track resource utilization, service health, and billing metrics. Optimize cloud costs.
- Network Monitoring: Keep an eye on network devices like routers, switches, and firewalls. Track traffic, bandwidth utilization, and device health. Identify bottlenecks and connectivity issues.
- Real User Monitoring (RUM): Monitor real user experience across platforms. Track page load times, transaction times, and user actions. Identify slow-loading pages and improve user experience.
- Synthetic Monitoring: Simulate user interactions to proactively detect performance issues before they impact real users. Automate performance testing.
Additional Features:
- Log Management: Assemble and analyze logs from various sources. Correlate logs to identify root causes and generate reports.
- IT Automation: Automate tasks and workflows based on monitoring data. Trigger actions like server restarts, alerts, and ticket creation.
- Public Status Pages: Create and manage public status pages to proactively communicate IT outages and maintenance activities.
- RMM for MSPs and CSPs: Remote monitoring and management features for Managed Service Providers and Cloud Service Providers.
- Customizable Dashboards and Reports: Build personalized dashboards and generate detailed reports for comprehensive insights.
- Integrations: Integrate Site24x7 with various tools and platforms for broader ecosystem visibility and streamlined workflows.
This is just a glimpse into the extensive feature set of Site24x7. Depending on your specific needs, you might find additional functionalities valuable, like mobile app monitoring, advanced alert configurations, and root cause analysis tools.
How Site24x7 works and Architecture?

Site24x7 utilizes a distributed architecture designed for scalability, reliability, and comprehensive monitoring of your IT infrastructure. Here’s a breakdown of the key components and their interplay:
1. Global Monitoring Network:
- A vast network of probes located in over 130 locations worldwide.
- These probes simulate user interactions and gather performance data from your websites, servers, and applications.
- Geographical diversity ensures accurate monitoring regardless of user location.
2. Data Collection and Aggregation:
- Probe data is securely transmitted to geographically distributed data centers for processing and analysis.
- Metrics from various monitoring types (websites, servers, applications, etc.) are combined and correlated for holistic insights.
3. Monitoring and Analysis Engines:
- Powerful engines analyze the collected data to identify performance issues, resource bottlenecks, and potential anomalies.
- Real-time dashboards and historical reports provide detailed insights into your IT infrastructure’s health and performance.
- Machine learning algorithms detect patterns and predict potential issues before they impact users.
4. Alerting and Notification System:
- Customizable alert thresholds are set for critical metrics across all monitoring domains.
- When thresholds are breached, the system triggers instant notifications via email, SMS, push notifications, or integrations with other tools.
- This enables for proactive issue identification and resolution.
5. User Interface and Reporting:
- Site24x7 offers a user-friendly web interface for accessing all monitoring data, reports, and analytics.
- Users can:
- View real-time and historical overviews of various monitored elements.
- Analyze trends and identify patterns for proactive maintenance.
- Share reports and collaborate with team members.
- Customize dashboards and monitoring configurations to suit specific needs.
Additional Architectural Aspects:
- Scalability: The distributed architecture can handle large volumes of data from diverse infrastructure, catering to organizations of all sizes.
- Security: Data transmission and storage are secured with industry-standard encryption protocols and intrusion detection systems.
- High Availability: Redundancy measures ensure minimal downtime and uninterrupted monitoring even during unexpected events.
- API Access: Access and manage your monitoring data programmatically through Site24x7’s REST API.
Overall, Site24x7’s architecture focuses on collecting comprehensive data from various sources, analyzing it intelligently, and presenting it in a way that empowers users to proactively manage their IT infrastructure and ensure optimal performance.
How to Install Site24x7 it?
Installing Site24x7 involves two primary steps:
1. Signing Up and Setting Up Your Account:
- Create a Site24x7 account: Visit Site24x7 official site and sign up using your email address.
- Choose a plan: Select the plan that aligns with your monitoring needs and budget.
- Add monitors: Once your account is active, you’ll be guided through adding monitors for your websites, servers, applications, or other IT infrastructure components.
2. Installing Agents (for Server and Application Monitoring):
- Download agents: For server monitoring and APM, download the appropriate agent software from your Site24x7 dashboard.
- Install agents: Follow the provided instructions to install the agents on your servers or application servers. The installation process typically involves:
- Running an installation script or executable file.
- Providing your Site24x7 account details and agent configuration settings.
Specific Installation Methods:
- Server Monitoring:
- Manual installation using scripts or installation wizards.
- Bulk installation for multiple servers using tools like SaltStack or SSH.
- Integration with cloud platforms for agent deployment on cloud instances.
- Application Performance Monitoring (APM):
- Agent installation within your application servers or Java Virtual Machines (JVMs).
Web and Network Monitoring:
- No agent installation required: These monitoring types rely on Site24x7’s global probes and network devices to gather data without installing any software on your web servers or network infrastructure.
Important Considerations:
- Firewall configuration: Ensure firewall rules allow communication between agents and Site24x7 servers.
- Integrations: Configure integrations with other tools like Slack, PagerDuty, or ticketing systems for seamless alerts and notifications.
- Customization: Customize monitoring settings, alerts, and dashboards to align with your specific needs.
Site24x7 provides detailed documentation and support for the installation process. If you encounter any challenges, you can refer to their knowledge base or contact their support team.
Basic Tutorials of Site24x7: Getting Started

That’s fantastic! Website monitoring sounds like a great starting point for your Site24x7 exploration. Here’s a step-by-step basic tutorial to set up website uptime checks:
1. Create a Free Account:
- Head over to Site24x7 official site and click “Sign Up”.
- Enter your email address and create a password.
- Accomplish the signup process and verify your email.
2. Add Your Website:
- Click “Monitors” from the main menu.
- Select “Web” from the “Add Monitor” options.
- Attach your website URL in the “Display Name” field.
- Choose a monitoring protocol (HTTP or HTTPS).
- Optionally, configure advanced settings like monitoring frequency, alerting thresholds, and location checks.
3. Verify and Start Monitoring:
- Click “Start Monitoring” to initiate the setup process.
- Site24x7 will perform an initial website check and display the results.
- If everything looks good, click “Save Monitor” to activate the uptime monitoring.
4. Review Monitoring Results:
- Head back to the “Monitors” section.
- You’ll see your website listed with its current status (up or down).
- Click on the website name to access detailed reports and historical data.
- Analyze the uptime history, response times, and other metrics to understand your website’s performance.
Bonus Tips:
- Use the “Alert Profiles” section to configure email or SMS notifications for website downtimes or performance issues.
- Explore the “Web Page Speed” feature to analyze page load times and identify optimization opportunities.
- Check out the Site24x7 Knowledge Base and blog for comprehensive guides and insights on various monitoring features.
This is just a basic setup, and Site24x7 offers extensive website monitoring capabilities.
Enjoy monitoring your website with Site24x7!

👤 About the Author
Rahul is passionate about DevOps, DevSecOps, SRE, MLOps, and AiOps. Driven by a love for innovation and continuous improvement, Rahul enjoys helping engineers and organizations embrace automation, reliability, and intelligent IT operations. Connect with Rahul and stay up-to-date with the latest in tech!
🌐 Connect with Rahul
-
Website: MotoShare.in
-
Facebook: facebook.com/DevOpsSchool
-
X (Twitter): x.com/DevOpsSchools
-
LinkedIn: linkedin.com/company/devopsschool
-
YouTube: youtube.com/@TheDevOpsSchool
-
Instagram: instagram.com/devopsschool
-
Quora: devopsschool.quora.com
-
Email: contact@devopsschool.com

