
 Starting: 1st of Every Month
  +91 8409492687
  Contact@DevOpsSchool.com
SLO (Service Level Objective) is a key concept in Site Reliability Engineering (SRE) and system reliability management. It represents a measurable, specific target or goal for a particular service’s reliability, performance, or availability over a defined period.
Key Components of SLO:
- Measurable Metric: An SLO is tied to a specific, measurable metric such as uptime, response time, latency, or error rate.
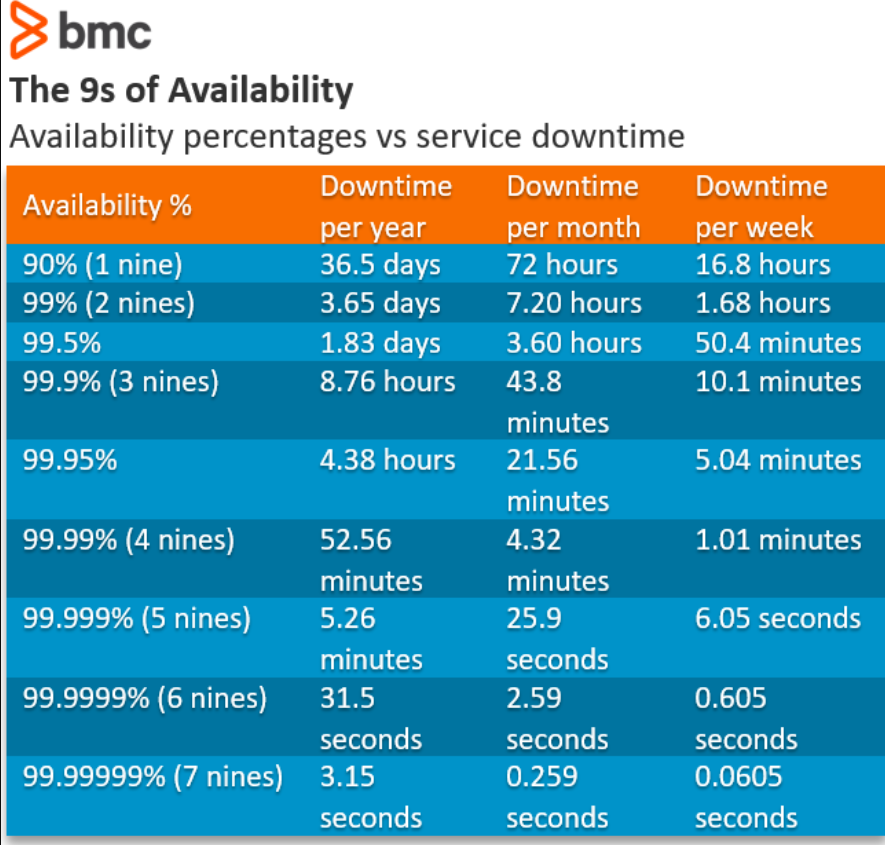
- Target Threshold: It defines the acceptable threshold for the metric, often expressed as a percentage or a fixed value (e.g., 99.9% uptime or latency below 200ms).
- Timeframe: The SLO applies to a specific period, such as a day, week, or month.
Example:
- An SLO for a website might be:
“The website should have 99.9% uptime over the course of one month.”
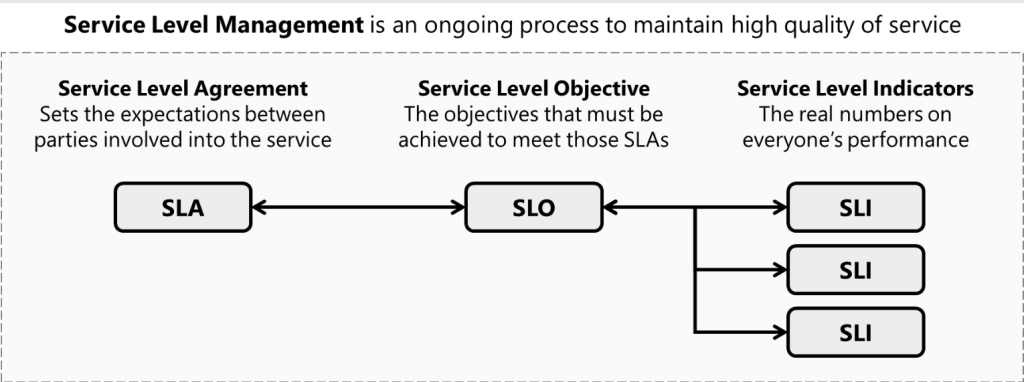
SLO vs. SLA vs. SLI:
- SLI (Service Level Indicator): The actual measurement of a system’s performance (e.g., “98% uptime in the last 30 days”).
- SLO (Service Level Objective): The goal or target for SLIs (e.g., “99.9% uptime over a month”).
- SLA (Service Level Agreement): A contractual agreement between a service provider and customers, often based on SLOs (e.g., “We guarantee 99.9% uptime, or you get a refund”).
Importance of SLOs:
- Clarity on Expectations: SLOs help define clear expectations for system performance and reliability.
- Customer Satisfaction: They align system performance with user and business needs.
- Prioritization: SLOs guide prioritization of tasks by showing where reliability improvements are necessary.
- Error Budgets: SLOs enable teams to use error budgets, balancing innovation and reliability.
SLOs are essential for maintaining a balance between delivering a reliable service and the cost of achieving that reliability.
What is the use cases of SLO?
Service Level Objectives (SLOs) have several important use cases in modern software development and operations:
- Setting Performance Targets: SLOs define specific, measurable targets for service performance and reliability, such as “99.9% of requests should be served within 200 milliseconds”[6].
- Enhancing Customer Satisfaction: By consistently meeting or exceeding reliability targets defined in SLOs, organizations can significantly improve customer satisfaction and retention[6].
- Aligning Teams: SLOs create a shared understanding of reliability across development, operations, and business teams, fostering collaboration and breaking down silos[6].
- Data-Driven Decision Making: Tracking performance against SLOs enables teams to identify areas for improvement and prioritize efforts based on data[6].
- Resource Allocation: SLOs help organizations understand how to allocate resources effectively to meet service requirements and optimize performance[5].
- Improving Service Reliability: By setting and monitoring SLOs, teams can proactively address potential issues before they impact users, thereby enhancing overall service reliability[4].
- Operational Efficiency: SLOs provide specific targets for teams to aim for, minimizing confusion and misalignment across departments[4].
- Accountability: SLOs foster a culture of accountability among teams by setting clear expectations for service performance[4].
- Balancing Innovation and Stability: SLOs help organizations strike a balance between delivering new features and maintaining service reliability[1].
- Compliance and Reporting: SLOs can be used to demonstrate compliance with service level agreements (SLAs) and provide stakeholders with clear performance metrics[2].
By implementing SLOs, organizations can create a more reliable, efficient, and customer-focused service environment.
What are the top 30 SLO metrices?
Here is a list of the top 30 SLO (Service Level Objective) metrics commonly used in Site Reliability Engineering (SRE) and system reliability management. These metrics cover a wide range of areas such as availability, performance, scalability, and user experience:
1. Availability Metrics
- Uptime Percentage: Percentage of time the service is available (e.g., 99.9% uptime).
- Downtime: Total time the service was unavailable within a period.
- Mean Time Between Failures (MTBF): Average time between two consecutive failures.
- Mean Time to Recovery (MTTR): Average time taken to recover from a failure.
2. Performance Metrics
- Latency: Time taken to respond to a user request (e.g., 95% of requests have a latency <200ms).
- Throughput: Number of requests served per second.
- Response Time Percentiles: Response times at specific percentiles (e.g., P95, P99).
- Error Rate: Percentage of failed requests over total requests (e.g., <1%).
3. Scalability Metrics
- Request Rate: Maximum number of requests the system can handle without degradation.
- Concurrent Users: Number of users the system can handle simultaneously.
- CPU Utilization: Percentage of CPU used under expected load.
- Memory Utilization: Percentage of memory used under expected load.
4. Reliability Metrics
- Service Degradation Rate: Percentage of requests that meet degraded but acceptable performance criteria.
- Retry Rate: Percentage of requests that required retries due to transient errors.
- Queue Length: Number of pending requests in the system queue.
- Data Consistency: Rate of consistency across distributed systems.
5. Error Metrics
- HTTP Error Codes: Percentage of responses with error codes (e.g., 4xx, 5xx).
- Timeout Rate: Percentage of requests that timed out.
- Dropped Requests: Percentage of requests dropped due to system overload.
6. Security Metrics
- Authentication Success Rate: Percentage of successful authentication attempts.
- Authorization Failure Rate: Percentage of requests denied due to failed authorization.
- Security Incident Response Time: Average time to detect and resolve security incidents.
7. User Experience Metrics
- Page Load Time: Time it takes for a page to fully load for end users.
- Apdex Score: User satisfaction index based on response times.
- Error Visibility: Percentage of user-visible errors (e.g., broken pages or features).
- Session Completion Rate: Percentage of user sessions that successfully complete a defined workflow.
8. Infrastructure Metrics
- Disk I/O Latency: Time taken for read/write operations.
- Network Latency: Time taken for data packets to travel between systems.
- Network Throughput: Amount of data transmitted per second.
- Cache Hit Ratio: Percentage of requests served from the cache instead of the backend.
Examples of SLO Definitions
| SLO Metric | SLO Target |
|---|---|
| Uptime Percentage | 99.9% over 30 days |
| Latency | 95% of requests under 200ms |
| Error Rate | Less than 1% of total requests |
| Authentication Success Rate | Greater than 99.5% |
| Network Latency | Average latency below 100ms |
| Page Load Time | 90% of users experience load time under 3 seconds |
| Cache Hit Ratio | At least 85% of requests served from the cache |
Choosing SLO Metrics
The choice of SLO metrics depends on the service’s goals and user expectations. For example:
- Customer-facing applications prioritize latency, availability, and page load time.
- APIs and backend services focus on throughput, error rates, and data consistency.
- Infrastructure services emphasize scalability, CPU utilization, and disk latency.
These metrics, when tracked and managed effectively, ensure high reliability and performance, aligning with both technical and business objectives.
Why SLO is being used by SRE Engineer?
SLO (Service Level Objective) is a critical tool for Site Reliability Engineers (SREs) because it provides a structured, measurable framework to balance system reliability with innovation. Here’s why SREs rely on SLOs:
1. Define and Measure Reliability
- Purpose: SLOs define clear, measurable goals for system performance and reliability.
- Why Important: They allow SREs to quantify reliability using metrics like availability, latency, and error rates.
- Example: “99.9% of requests should be served within 200ms.”
2. Prioritize Work
- Purpose: SLOs help SREs prioritize tasks that improve or maintain system reliability.
- Why Important: By focusing on areas where reliability falls below the defined SLOs, SREs can address the most impactful issues first.
- Example: If error rates exceed the SLO, SREs focus on debugging and fixing those errors instead of adding new features.
3. Manage Trade-offs with Error Budgets
- Purpose: SLOs enable the use of error budgets, which are the acceptable level of unreliability within a defined period.
- Why Important: This helps balance the need for reliability with the need for innovation. Teams can take calculated risks for new deployments as long as they stay within the error budget.
- Example: If an SLO allows for 0.1% downtime and the team has only used 0.05%, they can proceed with a potentially risky release.
4. Align Engineering Efforts with Business Goals
- Purpose: SLOs ensure that system reliability aligns with user expectations and business requirements.
- Why Important: Over-investing in reliability beyond user needs can be expensive, while under-investing can lead to customer dissatisfaction and churn.
- Example: A consumer-facing app might have a higher availability SLO (99.99%) than an internal tool (99.5%) based on user impact.
5. Proactive Incident Management
- Purpose: SLOs act as early indicators of potential system issues.
- Why Important: Monitoring metrics tied to SLOs allows SREs to detect and address reliability issues before they impact users or violate SLAs.
- Example: An alert is triggered if latency exceeds the SLO threshold, enabling preemptive mitigation.
6. Drive Continuous Improvement
- Purpose: SLOs provide data to identify trends, learn from incidents, and implement improvements.
- Why Important: This fosters a culture of continuous improvement and ensures long-term system reliability.
- Example: A pattern of consistent breaches in availability SLOs may prompt infrastructure upgrades.
7. Build Customer Trust and Satisfaction
- Purpose: SLOs provide transparency and demonstrate a commitment to reliability.
- Why Important: Customers trust services that meet reliability targets consistently. Meeting SLOs builds credibility.
- Example: Publishing a 99.9% availability SLO and meeting it enhances customer confidence.
8. Basis for SLAs (Service Level Agreements)
- Purpose: SLOs form the foundation for contractual SLAs with customers.
- Why Important: By meeting SLOs internally, SREs ensure the organization honors its SLA commitments.
- Example: A company with an SLA of 99.9% uptime internally sets an SLO to maintain 99.95% uptime for extra assurance.
9. Enable Data-Driven Decision-Making
- Purpose: SLOs provide measurable metrics that guide decision-making.
- Why Important: They help SREs justify resource allocation, scaling decisions, or technical debt prioritization with hard data.
- Example: If SLO metrics indicate frequent latency breaches, scaling infrastructure might take precedence over feature development.
10. Promote Team Collaboration
- Purpose: SLOs act as shared goals across teams, promoting alignment.
- Why Important: Development, operations, and business teams collaborate more effectively when they have common objectives.
- Example: Developers and SREs jointly work towards maintaining latency below the SLO threshold.
Summary of Benefits for SREs
| Benefit | Why SLOs Help |
|---|---|
| Quantify Reliability | Provide clear, measurable targets for system performance. |
| Set Priorities | Focus efforts on issues with the greatest impact on reliability. |
| Enable Risk-Taking | Use error budgets to balance reliability and innovation. |
| Monitor Health Proactively | Detect and address issues before they impact users. |
| Support Business Goals | Ensure reliability aligns with customer and organizational needs. |
| Drive Improvements | Analyze SLO data to improve system architecture and processes. |
| Build Trust | Consistently meeting SLOs enhances customer satisfaction and confidence. |
| Simplify Collaboration | Align cross-functional teams on common reliability objectives. |
Conclusion
SLOs are essential for SREs because they provide a quantitative, actionable framework to measure, manage, and improve system reliability. They help balance innovation with reliability, ensuring systems meet user and business expectations without over-investing in unnecessary perfection.
I’m a DevOps/SRE/DevSecOps/Cloud Expert passionate about sharing knowledge and experiences. I am working at Cotocus. I blog tech insights at DevOps School, travel stories at Holiday Landmark, stock market tips at Stocks Mantra, health and fitness guidance at My Medic Plus, product reviews at I reviewed , and SEO strategies at Wizbrand.
Please find my social handles as below;
Rajesh Kumar Personal Website
Rajesh Kumar at YOUTUBE
Rajesh Kumar at INSTAGRAM
Rajesh Kumar at X
Rajesh Kumar at FACEBOOK
Rajesh Kumar at LINKEDIN
Rajesh Kumar at PINTEREST
Rajesh Kumar at QUORA
Rajesh Kumar at WIZBRAND
