Web analytics is a way of collecting and analyzing what’s happening on your website to see what your visitors are doing, where they come from, what they like, and a whole lot more. By using a web analytics tool to collect data, you will be able to know what is and is not working, and then steer your website in the right direction. There is a lot of data that you can collect on how to interact with people on your website. For example, you can track overall visits, the pages users spend the most time on, which sites took them to your site, and more.
If you are new to web analytics, the amount of information you can get can be overwhelming, as it has to figure out what to do with it. However, making sense of this data is necessary, as it will enable you to keep a finger on the pulse of your site.
For example, take ‘time’ on the site. This metric measures how long users spend on average on your site and on each of your pages individually. Generally, if visitors are spending only a few seconds on your website before leaving, it means that there is something wrong with it.
Five key web analytics you should be tracking:
- Overall traffic
- Bounce rate
- Traffic sources
- Desktop vs. mobile visits
- New and returning visitors
There are a lot of metrics that you can track using analytics tools. However, these five are a great place. Let’s start with our usual visitor numbers.
1. Overall traffic
When we talk about web traffic, we refer to the number of visits to your site over a certain period of time. This number is important because it tells you if your website is getting the attention it deserves.
Suppose you are getting about 50 visitors per day. If your website is around a year, this is a low number. However, it is decent if you set up shop a month in advance. In other words, it is important to monitor not only your traffic but the way it develops. As your website grows, your numbers will increase. If your traffic decreases over time, it is a marker that you are not doing something right. In most cases, this may be due to search engine optimization ( ) issues, so that is always a good place to start.

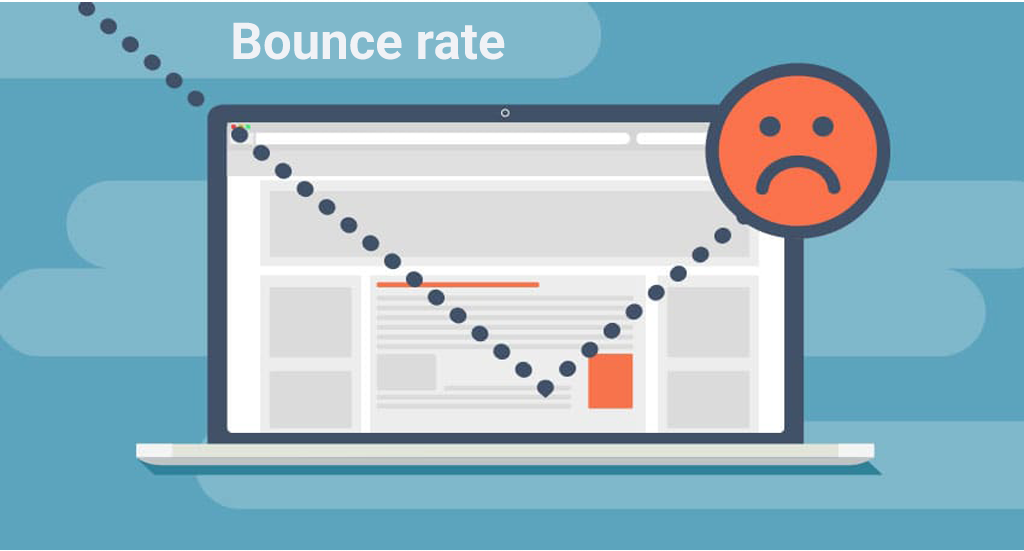
2. Bounce rate
When someone visits and leaves your site without seeing another page, we call it ‘bounce’. The percentage of visits that you measure against your overall traffic increases your bounce rate. This metric is important because it tells you if there are any outstanding usability issues with your website. Some common causes of high bounce rates include:
- Long loading times
- A clunky navigation scheme
- An unattractive web design
The average bounce rate for most websites is anywhere between 20 and 70% (less is better). However, as a rule of thumb, if your bounce rate is more than 30%, then you might want to consider closely the possible reasons we mentioned. However, the bounce rate depends a lot on what content your site provides and what searchers are looking for, so if you’re above that number then it’s not always a bad thing.

3. Traffic sources
In most cases, first-time visitors will find your website through a link rather than typing in your URL. The pages that link to your site are your traffic sources, and we can generally break them down into four categories:
- Search engines
- Links from other sites
- Visits from email campaigns
- Links from social media
Generally, you want to create all four sources of traffic. However, your primary focus will usually be search engines, as they have the potential to bring mass traffic. More importantly, if your website is consistently ranked high in search results, it becomes easy to get links from other sites, as they consider you a reputable source.
With web analytics tools, you can easily monitor your traffic sources and adjust your strategy accordingly. For example, if you don’t see much traffic from search engines, then you know that you have to modify your keyword strategy.

4. Desktop vs. mobile visits
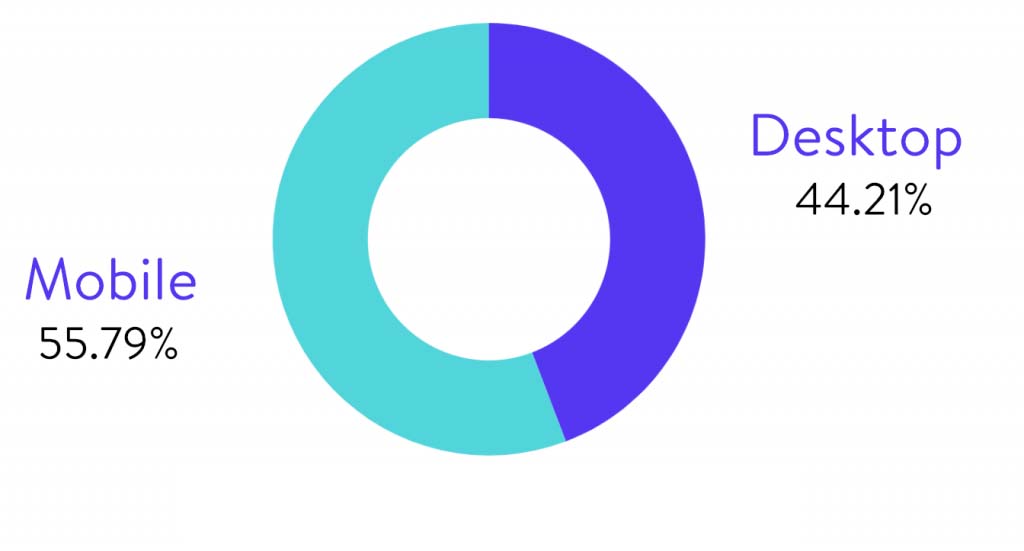
It may not be surprising to learn that mobile traffic is now completely adopted by many web users. In fact, it overtook regular desktop traffic some time ago, meaning it is essential to provide a strong mobile experience for your website. With analytics tools, you can track what percentage of users are visiting your site through a desktop or mobile browser. This is a simple enough metric to explain, and it tells you where to focus your efforts.
Even though your website is getting more desktop than mobile traffic, we recommend that you focus on optimizing its mobile experience. Adopting a mobile-first approach to web design will pay off in the long run.

5. New and returning visitors
Ideally, you want people to keep visiting your website more often. We ‘return visitors’ to those users, but you can also think of them as your main audience. A lot of people have different views on what a decent returning user rate is. In our experience, if your recurring traffic is about 30% of your total, then you are doing very well.
However, if it is less than 20%, it means that your website is not as attractive as it could be. This may be due to usability issues – such as those affecting your bounce rate – or your content strategy. In any case, this is the basis for closely tracking your site and figuring out how you can improve it.

I’m a DevOps/SRE/DevSecOps/Cloud Expert passionate about sharing knowledge and experiences. I am working at Cotocus. I blog tech insights at DevOps School, travel stories at Holiday Landmark, stock market tips at Stocks Mantra, health and fitness guidance at My Medic Plus, product reviews at I reviewed , and SEO strategies at Wizbrand.
Please find my social handles as below;
Rajesh Kumar Personal Website
Rajesh Kumar at YOUTUBE
Rajesh Kumar at INSTAGRAM
Rajesh Kumar at X
Rajesh Kumar at FACEBOOK
Rajesh Kumar at LINKEDIN
Rajesh Kumar at PINTEREST
Rajesh Kumar at QUORA
Rajesh Kumar at WIZBRAND

 Starting: 1st of Every Month
  +91 8409492687
  Contact@DevOpsSchool.com
