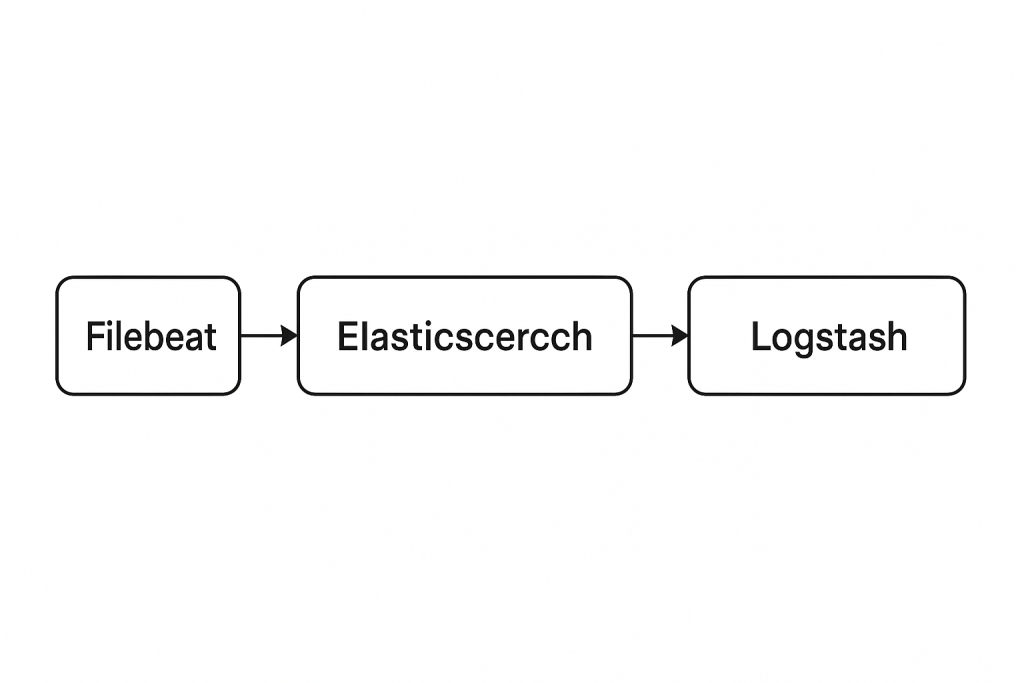
Filebeat client is a lightweight, resource-friendly tool that collects logs from files on the server and forwards these logs to your Logstash instance for processing. Filebeat is designed for reliability and low latency. Filebeat has a light resource footprint on the host machine, and the Beats input plugin minimizes the resource demands on the Logstash instance.
Prerequisite
To get started, go here to download the sample data set used in this example. Unpack the file.
$ wget https://download.elastic.co/demos/logstash/gettingstarted/logstash-tutorial.log.gz
Step 1 – Download your preferred beat. e.g filebeat
Using – https://www.elastic.co/downloads/beats/
Step 2 – Install a filebeat 7.x
Using – https://www.elastic.co/downloads/beats/filebeat
$ sudo yum install wget -y
$ wget https://artifacts.elastic.co/downloads/beats/filebeat/filebeat-7.15.0-linux-x86_64.tar.gz
$ tar -zxvf filebeat-7.15.0-linux-x86_64.tar.gz
Step 2 – Install a filebeat 9.x
sudo -s
cd
wget https://artifacts.elastic.co/downloads/beats/filebeat/filebeat-9.0.0-linux-x86_64.tar.gz
tar -zxvf filebeat-9.0.0-linux-x86_64.tar.gz
cd filebeat-9.0.0-linux-x86_64
vi filebeat.yml
sudo ./filebeat -e -c filebeat.yml
Step 3 – Configure a filebeat.yml input with a some log file
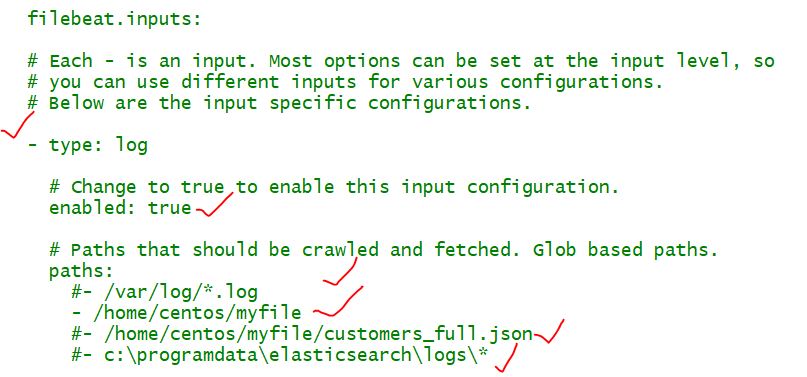
Open the filebeat.yml file located in your Filebeat installation directory, and replace the contents with the following lines. Make sure paths points to the example Apache log file, logstash-tutorial.log, that you downloaded earlier:
$ vi filebeat-7.15.0-linux-x86_64/filebeat.yml

enabled: true

filebeat.inputs:
- type: log
  paths:
    - /path/to/file/logstash-tutorial.log
output.logstash:
  hosts: ["localhost:5044"]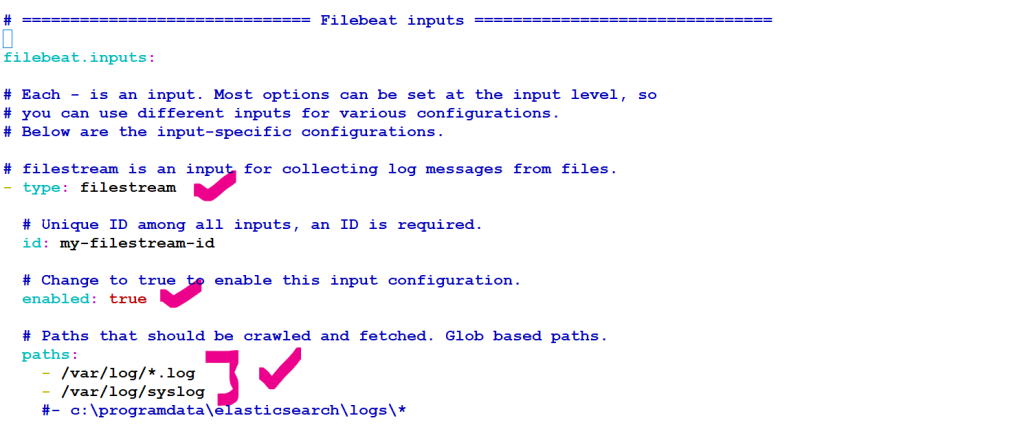
Step 4 – Configure a filebeat.yml output with Logstash or elasticsearch
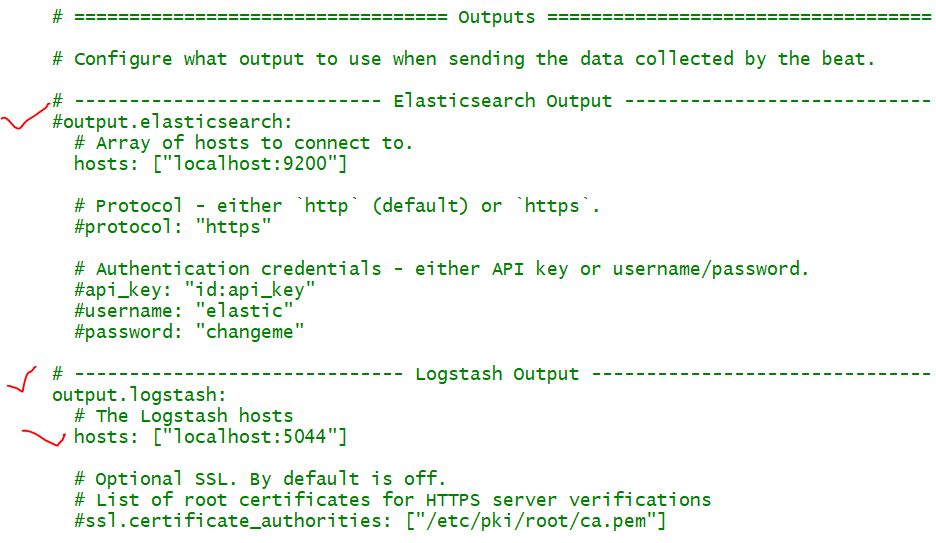
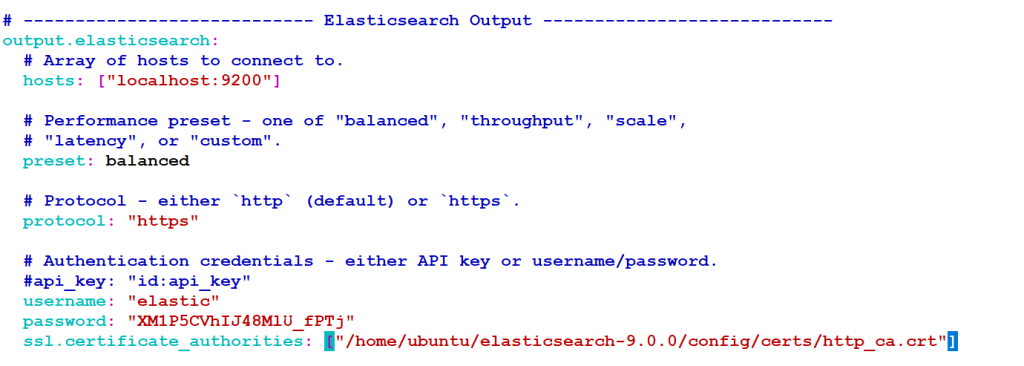
output.elasticsearch:
  # Array of hosts to connect to.
  hosts: ["localhost:9200"]

  # Performance preset - one of "balanced", "throughput", "scale",
  # "latency", or "custom".
  preset: balanced

  # Protocol - either `http` (default) or `https`.
  protocol: "https"

  # Authentication credentials - either API key or username/password.
  #api_key: "id:api_key"
  username: "elastic"
  password: "XM1P5CVhIJ48MlU_fPTj"
  ssl.certificate_authorities: ["/home/ubuntu/elasticsearch-9.0.0/config/certs/http_ca.crt"]
Step 5 – Start a logbeat
$ cd filebeat-7.2.0-linux-x86_64/
$ sudo chown root filebeat.yml
$ sudo ./filebeat -e -c filebeat.yml -d "publish"
or
$ sudo ./filebeat -e -c filebeat.yml
To run filebeat as a background process
$ sudo ./filebeat -e -c filebeat.yml -d "publish" &
$ screen -d -m ./filebeat -e -c filebeat.yml -d "publish"Filebeat will attempt to connect on port 5044. Until Logstash starts with an active Beats plugin, there won’t be any answer on that port, so any messages you see regarding failure to connect on that port are normal for now.
Configuration file of filebeats
| ###################### Filebeat Configuration Example ######################### | |
| # This file is an example configuration file highlighting only the most common | |
| # options. The filebeat.reference.yml file from the same directory contains all the | |
| # supported options with more comments. You can use it as a reference. | |
| # | |
| # You can find the full configuration reference here: | |
| # https://www.elastic.co/guide/en/beats/filebeat/index.html | |
| # For more available modules and options, please see the filebeat.reference.yml sample | |
| # configuration file. | |
| # ============================== Filebeat inputs =============================== | |
| filebeat.inputs: | |
| # Each - is an input. Most options can be set at the input level, so | |
| # you can use different inputs for various configurations. | |
| # Below are the input specific configurations. | |
| - type: log | |
| # Change to true to enable this input configuration. | |
| enabled: false | |
| # Paths that should be crawled and fetched. Glob based paths. | |
| paths: | |
| - /var/log/*.log | |
| #- c:\programdata\elasticsearch\logs\* | |
| # Exclude lines. A list of regular expressions to match. It drops the lines that are | |
| # matching any regular expression from the list. | |
| #exclude_lines: ['^DBG'] | |
| # Include lines. A list of regular expressions to match. It exports the lines that are | |
| # matching any regular expression from the list. | |
| #include_lines: ['^ERR', '^WARN'] | |
| # Exclude files. A list of regular expressions to match. Filebeat drops the files that | |
| # are matching any regular expression from the list. By default, no files are dropped. | |
| #exclude_files: ['.gz$'] | |
| # Optional additional fields. These fields can be freely picked | |
| # to add additional information to the crawled log files for filtering | |
| #fields: | |
| # level: debug | |
| # review: 1 | |
| ### Multiline options | |
| # Multiline can be used for log messages spanning multiple lines. This is common | |
| # for Java Stack Traces or C-Line Continuation | |
| # The regexp Pattern that has to be matched. The example pattern matches all lines starting with [ | |
| #multiline.pattern: ^\[ | |
| # Defines if the pattern set under pattern should be negated or not. Default is false. | |
| #multiline.negate: false | |
| # Match can be set to "after" or "before". It is used to define if lines should be append to a pattern | |
| # that was (not) matched before or after or as long as a pattern is not matched based on negate. | |
| # Note: After is the equivalent to previous and before is the equivalent to to next in Logstash | |
| #multiline.match: after | |
| # filestream is an input for collecting log messages from files. It is going to replace log input in the future. | |
| - type: filestream | |
| # Change to true to enable this input configuration. | |
| enabled: false | |
| # Paths that should be crawled and fetched. Glob based paths. | |
| paths: | |
| - /var/log/*.log | |
| #- c:\programdata\elasticsearch\logs\* | |
| # Exclude lines. A list of regular expressions to match. It drops the lines that are | |
| # matching any regular expression from the list. | |
| #exclude_lines: ['^DBG'] | |
| # Include lines. A list of regular expressions to match. It exports the lines that are | |
| # matching any regular expression from the list. | |
| #include_lines: ['^ERR', '^WARN'] | |
| # Exclude files. A list of regular expressions to match. Filebeat drops the files that | |
| # are matching any regular expression from the list. By default, no files are dropped. | |
| #prospector.scanner.exclude_files: ['.gz$'] | |
| # Optional additional fields. These fields can be freely picked | |
| # to add additional information to the crawled log files for filtering | |
| #fields: | |
| # level: debug | |
| # review: 1 | |
| # ============================== Filebeat modules ============================== | |
| filebeat.config.modules: | |
| # Glob pattern for configuration loading | |
| path: ${path.config}/modules.d/*.yml | |
| # Set to true to enable config reloading | |
| reload.enabled: false | |
| # Period on which files under path should be checked for changes | |
| #reload.period: 10s | |
| # ======================= Elasticsearch template setting ======================= | |
| setup.template.settings: | |
| index.number_of_shards: 1 | |
| #index.codec: best_compression | |
| #_source.enabled: false | |
| # ================================== General =================================== | |
| # The name of the shipper that publishes the network data. It can be used to group | |
| # all the transactions sent by a single shipper in the web interface. | |
| #name: | |
| # The tags of the shipper are included in their own field with each | |
| # transaction published. | |
| #tags: ["service-X", "web-tier"] | |
| # Optional fields that you can specify to add additional information to the | |
| # output. | |
| #fields: | |
| # env: staging | |
| # ================================= Dashboards ================================= | |
| # These settings control loading the sample dashboards to the Kibana index. Loading | |
| # the dashboards is disabled by default and can be enabled either by setting the | |
| # options here or by using the `setup` command. | |
| #setup.dashboards.enabled: false | |
| # The URL from where to download the dashboards archive. By default this URL | |
| # has a value which is computed based on the Beat name and version. For released | |
| # versions, this URL points to the dashboard archive on the artifacts.elastic.co | |
| # website. | |
| #setup.dashboards.url: | |
| # =================================== Kibana =================================== | |
| # Starting with Beats version 6.0.0, the dashboards are loaded via the Kibana API. | |
| # This requires a Kibana endpoint configuration. | |
| setup.kibana: | |
| # Kibana Host | |
| # Scheme and port can be left out and will be set to the default (http and 5601) | |
| # In case you specify and additional path, the scheme is required: http://localhost:5601/path | |
| # IPv6 addresses should always be defined as: https://[2001:db8::1]:5601 | |
| #host: "localhost:5601" | |
| # Kibana Space ID | |
| # ID of the Kibana Space into which the dashboards should be loaded. By default, | |
| # the Default Space will be used. | |
| #space.id: | |
| # =============================== Elastic Cloud ================================ | |
| # These settings simplify using Filebeat with the Elastic Cloud (https://cloud.elastic.co/). | |
| # The cloud.id setting overwrites the `output.elasticsearch.hosts` and | |
| # `setup.kibana.host` options. | |
| # You can find the `cloud.id` in the Elastic Cloud web UI. | |
| #cloud.id: | |
| # The cloud.auth setting overwrites the `output.elasticsearch.username` and | |
| # `output.elasticsearch.password` settings. The format is `<user>:<pass>`. | |
| #cloud.auth: | |
| # ================================== Outputs =================================== | |
| # Configure what output to use when sending the data collected by the beat. | |
| # ---------------------------- Elasticsearch Output ---------------------------- | |
| output.elasticsearch: | |
| # Array of hosts to connect to. | |
| hosts: ["localhost:9200"] | |
| # Protocol - either `http` (default) or `https`. | |
| #protocol: "https" | |
| # Authentication credentials - either API key or username/password. | |
| #api_key: "id:api_key" | |
| #username: "elastic" | |
| #password: "changeme" | |
| # ------------------------------ Logstash Output ------------------------------- | |
| #output.logstash: | |
| # The Logstash hosts | |
| #hosts: ["localhost:5044"] | |
| # Optional SSL. By default is off. | |
| # List of root certificates for HTTPS server verifications | |
| #ssl.certificate_authorities: ["/etc/pki/root/ca.pem"] | |
| # Certificate for SSL client authentication | |
| #ssl.certificate: "/etc/pki/client/cert.pem" | |
| # Client Certificate Key | |
| #ssl.key: "/etc/pki/client/cert.key" | |
| # ================================= Processors ================================= | |
| processors: | |
| - add_host_metadata: | |
| when.not.contains.tags: forwarded | |
| - add_cloud_metadata: ~ | |
| - add_docker_metadata: ~ | |
| - add_kubernetes_metadata: ~ | |
| # ================================== Logging =================================== | |
| # Sets log level. The default log level is info. | |
| # Available log levels are: error, warning, info, debug | |
| #logging.level: debug | |
| # At debug level, you can selectively enable logging only for some components. | |
| # To enable all selectors use ["*"]. Examples of other selectors are "beat", | |
| # "publisher", "service". | |
| #logging.selectors: ["*"] | |
| # ============================= X-Pack Monitoring ============================== | |
| # Filebeat can export internal metrics to a central Elasticsearch monitoring | |
| # cluster. This requires xpack monitoring to be enabled in Elasticsearch. The | |
| # reporting is disabled by default. | |
| # Set to true to enable the monitoring reporter. | |
| #monitoring.enabled: false | |
| # Sets the UUID of the Elasticsearch cluster under which monitoring data for this | |
| # Filebeat instance will appear in the Stack Monitoring UI. If output.elasticsearch | |
| # is enabled, the UUID is derived from the Elasticsearch cluster referenced by output.elasticsearch. | |
| #monitoring.cluster_uuid: | |
| # Uncomment to send the metrics to Elasticsearch. Most settings from the | |
| # Elasticsearch output are accepted here as well. | |
| # Note that the settings should point to your Elasticsearch *monitoring* cluster. | |
| # Any setting that is not set is automatically inherited from the Elasticsearch | |
| # output configuration, so if you have the Elasticsearch output configured such | |
| # that it is pointing to your Elasticsearch monitoring cluster, you can simply | |
| # uncomment the following line. | |
| #monitoring.elasticsearch: | |
| # ============================== Instrumentation =============================== | |
| # Instrumentation support for the filebeat. | |
| #instrumentation: | |
| # Set to true to enable instrumentation of filebeat. | |
| #enabled: false | |
| # Environment in which filebeat is running on (eg: staging, production, etc.) | |
| #environment: "" | |
| # APM Server hosts to report instrumentation results to. | |
| #hosts: | |
| # - http://localhost:8200 | |
| # API Key for the APM Server(s). | |
| # If api_key is set then secret_token will be ignored. | |
| #api_key: | |
| # Secret token for the APM Server(s). | |
| #secret_token: | |
| # ================================= Migration ================================== | |
| # This allows to enable 6.7 migration aliases | |
| #migration.6_to_7.enabled: true | |
To delete the Filebeat registry file
For example, run:

$ cd /home/ec2-user/filebeat-7.2.0-linux-x86_64
$ sudo rm -rf data/registry
$ sudo chown root filebeat.yml
$ sudo ./filebeat -e -c filebeat.yml -d "publish"
$ sudo ./filebeat -e -c filebeat.yml -d "publish"I’m a DevOps/SRE/DevSecOps/Cloud Expert passionate about sharing knowledge and experiences. I am working at Cotocus. I blog tech insights at DevOps School, travel stories at Holiday Landmark, stock market tips at Stocks Mantra, health and fitness guidance at My Medic Plus, product reviews at I reviewed , and SEO strategies at Wizbrand.
Do you want to learn Quantum Computing?
Please find my social handles as below;
Rajesh Kumar Personal Website
Rajesh Kumar at YOUTUBE
Rajesh Kumar at INSTAGRAM
Rajesh Kumar at X
Rajesh Kumar at FACEBOOK
Rajesh Kumar at LINKEDIN
Rajesh Kumar at PINTEREST
Rajesh Kumar at QUORA
Rajesh Kumar at WIZBRAND
