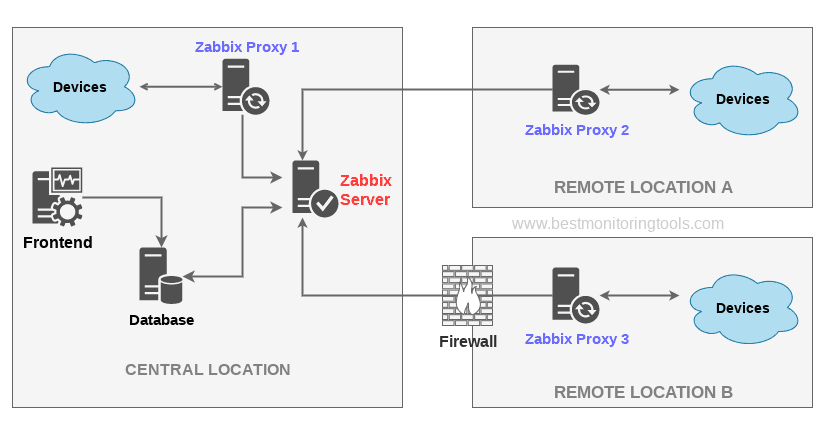
Zabbix Proxy is a component of the Zabbix monitoring and alerting system, which is used to monitor the health and performance of IT infrastructure components such as servers, network devices, and applications. Zabbix is an open-source software that provides centralized monitoring, alerting, and reporting capabilities.
RULE # 1 -Before you install proxy, keep in mind that your proxy version must match the Zabbix server version!
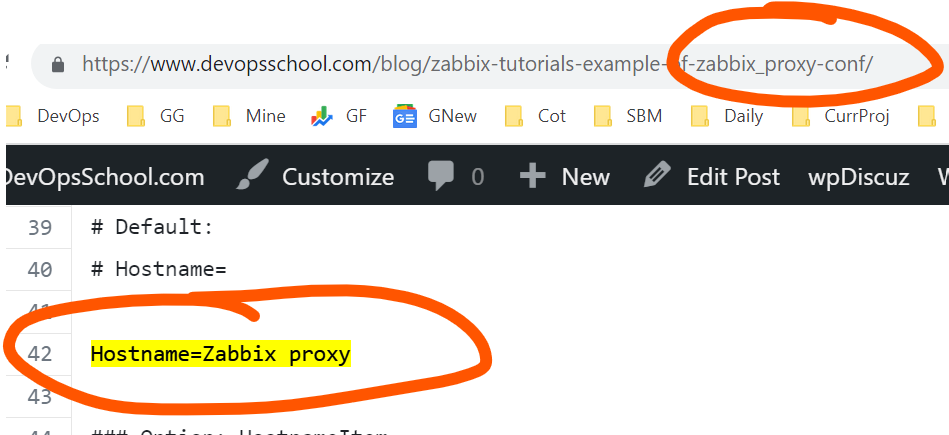
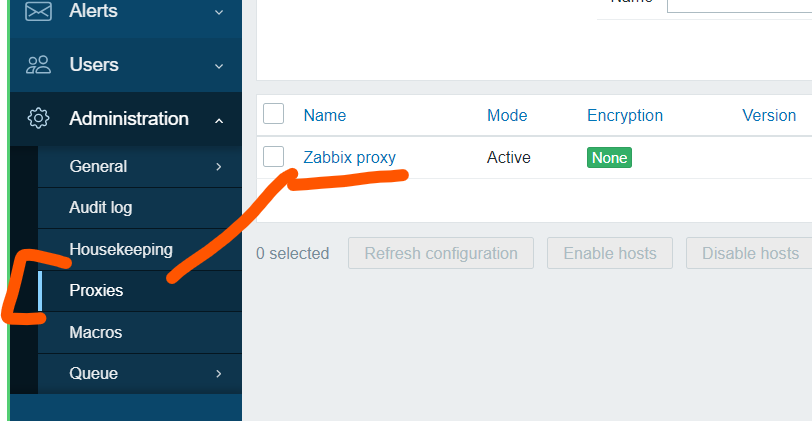
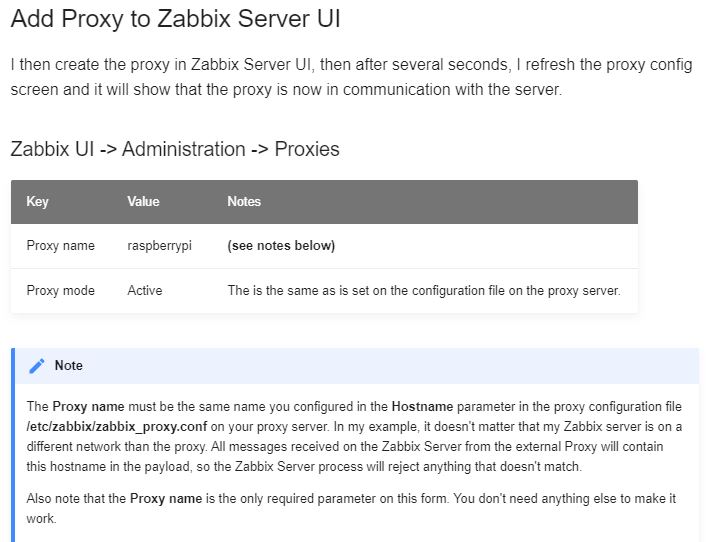
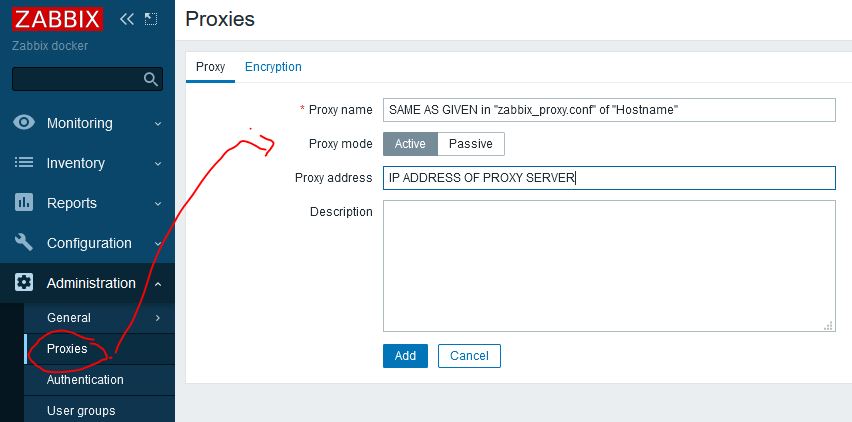
RULE # 2 – Proxy Name MUST Matched Of Zabbix Server and Zabbix Proxy Config file.
How Zabbix Proxy Works?
A Zabbix proxy is a process that collects monitoring data from one or more monitored devices and sends the information to the Zabbix server, essentially working on behalf of the server. All collected data is buffered locally and then transferred to the Zabbix server the proxy belongs to.
The Zabbix proxy works as follows:
- The proxy connects to the Zabbix server and registers itself.
- The proxy receives a list of hosts that it is responsible for monitoring.
- The proxy starts collecting data from the hosts.
- The proxy buffers the collected data locally.
- The proxy periodically sends the buffered data to the Zabbix server.
The Zabbix proxy can be used to:
- Offload the Zabbix server when monitoring a large number of hosts.
- Monitor remote locations.
- Monitor locations with unreliable communications.
- Simplify the maintenance of distributed monitoring.
The Zabbix proxy is a powerful tool that can be used to improve the performance and scalability of a Zabbix monitoring system.
Here are some of the benefits of using a Zabbix proxy:
- Reduced load on the Zabbix server: The proxy can collect data from the monitored hosts, which reduces the load on the Zabbix server.
- Improved scalability: The Zabbix proxy can be used to monitor a large number of hosts, which improves the scalability of the monitoring system.
- Increased reliability: The proxy can be used to monitor hosts in remote locations or locations with unreliable communications.
- Simplified maintenance: The proxy can be used to simplify the maintenance of the monitoring system by centralizing the configuration and management of the proxies.
Here are the differences between a Zabbix proxy and a Zabbix server:
- A Zabbix proxy is a lightweight process that collects data from the monitored hosts and sends it to the Zabbix server. A Zabbix server is a more powerful process that stores and processes the data collected by the proxies.
- A Zabbix proxy can only monitor a limited number of hosts, while a Zabbix server can monitor an unlimited number of hosts.
- A Zabbix proxy is not a full-featured Zabbix server, so it cannot be used to perform all of the tasks that a Zabbix server can perform.
What are the component of Zabbix Proxy?
The Zabbix proxy is a lightweight process that collects monitoring data from one or more monitored devices and sends the information to the Zabbix server, essentially working on behalf of the server. All collected data is buffered locally and then transferred to the Zabbix server the proxy belongs to.
The Zabbix proxy has the following components:
- Configuration file: The configuration file contains the settings for the Zabbix proxy, such as the IP address of the Zabbix server, the port number, and the list of hosts that the proxy is responsible for monitoring.
- Data buffer: The data buffer is used to store the monitoring data collected by the proxy before it is sent to the Zabbix server.
- Sender: The sender is responsible for sending the monitoring data from the data buffer to the Zabbix server.
- Poller: The poller is responsible for collecting monitoring data from the monitored hosts.
The Zabbix proxy can be configured to collect a variety of monitoring data, such as CPU usage, memory usage, disk usage, and network traffic. The Zabbix proxy can also be configured to send notifications when certain thresholds are met.
Here are the steps on how to configure a Zabbix proxy:
- Install the Zabbix proxy on the machine that you want to use as a proxy.
- Configure the Zabbix proxy by editing the configuration file.
- Start the Zabbix proxy.
- In the Zabbix web interface, add the Zabbix proxy to the Zabbix server.
- Assign the hosts that you want the Zabbix proxy to monitor to the Zabbix proxy.
Zabbix Proxy Architecture
The Zabbix proxy architecture is a distributed monitoring system that consists of a Zabbix server, one or more Zabbix proxies, and one or more Zabbix agents.
The Zabbix server is the central component of the system and is responsible for storing and processing the monitoring data collected by the proxies and agents. The Zabbix server also provides a web-based user interface for monitoring the system and managing the proxies and agents.
The Zabbix proxy is a lightweight process that collects monitoring data from one or more monitored devices and sends the information to the Zabbix server. All collected data is buffered locally and then transferred to the Zabbix server the proxy belongs to.
The Zabbix agent is a small program that is installed on the monitored devices. The Zabbix agent collects monitoring data from the device and sends it to the Zabbix proxy or server.
The Zabbix proxy architecture is designed to scale to large numbers of devices and hosts. The Zabbix server can handle a large number of proxies, and each proxy can monitor a large number of hosts.
The Zabbix proxy architecture is also designed to be fault-tolerant. If a Zabbix proxy fails, the Zabbix server will continue to function and the monitoring data will be collected by the other proxies.
Here are some of the benefits of using the Zabbix proxy architecture:
- Scalability: The Zabbix proxy architecture can be scaled to large numbers of devices and hosts.
- Fault tolerance: The Zabbix proxy architecture is fault-tolerant and can continue to function even if a Zabbix proxy fails.
- Centralized management: The Zabbix server provides a centralized management interface for managing the proxies and agents.
- Reduced load on the Zabbix server: The Zabbix proxy can offload some of the load from the Zabbix server by collecting monitoring data from the monitored hosts.
| # You can check Zabbix server version with the command "zabbix_server -V": | |
| $ zabbix_server -V | |
| # INSTALLING PACKAGES | |
| # Zabbix 5.0 LTS | |
| $ wget https://repo.zabbix.com/zabbix/5.0/ubuntu/pool/main/z/zabbix-release/zabbix-release_5.0-1+focal_all.deb | |
| $ dpkg -i zabbix-release_5.0-1+focal_all.deb | |
| # apt update | |
| OR | |
| # Zabbix 5.4 LATEST | |
| $ wget https://repo.zabbix.com/zabbix/5.4/ubuntu/pool/main/z/zabbix-release/zabbix-release_5.4-1+ubuntu20.04_all.deb | |
| $ dpkg -i zabbix-release_5.4-1+ubuntu20.04_all.deb | |
| $ apt update | |
| $ apt-get install zabbix-proxy-mysql zabbix-sql-scripts | |
| # Install MariaDB | |
| $ sudo apt -y install mariadb-common mariadb-server mariadb-client | |
| $ systemctl start mariadb | |
| $ sudo systemctl enable mariadb | |
| # Create initial database | |
| $ mysql -uroot -p | |
| Enter password: <PRESS ENTER> | |
| mysql> create database zabbix character set utf8 collate utf8_bin; | |
| mysql> create user zabbix@localhost identified by 'password'; | |
| mysql> grant all privileges on zabbix.* to zabbix@localhost; | |
| mysql> quit; | |
| # CREATING PROXY DATABASE | |
| $ zcat /usr/share/zabbix-proxy-mysql/schema.sql.gz | mysql -u zabbix zabbix -p | |
| Enter password: password | |
| OR | |
| $ zcat /usr/share/doc/zabbix-proxy-mysql/schema.sql.gz | mysql -u zabbix zabbix -p | |
| Enter password: password | |
| OR | |
| $ zcat /usr/share/doc/zabbix-sql-scripts/mysql/schema.sql.gz | mysql -u zabbix zabbix -p | |
| # STARTING ZABBIX PROXY PROCESS | |
| $ service zabbix-proxy start | |
| # DATABASE CONFIGURATION FOR ZABBIX PROXY | |
| $ vi /etc/zabbix/zabbix_proxy.conf | |
| DBHost=localhost | |
| DBName=zabbix | |
| DBUser=zabbix | |
| DBPassword=zabbix | |
| # Zabbix Server CONFIGURATION FOR ZABBIX PROXY | |
| Server=10.7.44.235 (IP ADDRESS OF ZABBIX SERVER) | |
| Hostname=Zabbix-proxy-1 | |
| # Start and enable proxy service | |
| $ sudo systemctl restart zabbix-proxy | |
| $ sudo systemctl enable zabbix-proxy | |
| # LOG FILE LOCATION | |
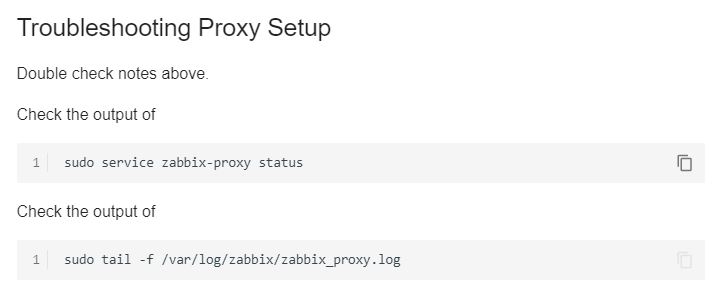
| /var/log/zabbix-proxy/zabbix_proxy.log | |
| or | |
| /var/log/zabbix/zabbix_proxy.log |

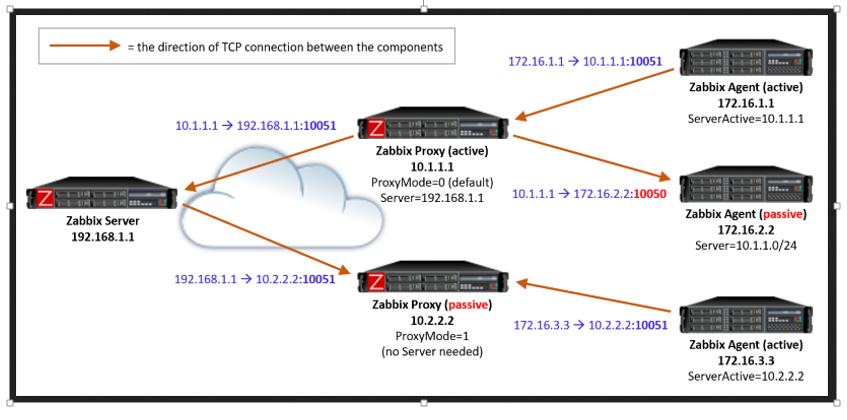
Understanding Zabbix proxy Active vs Passive mod
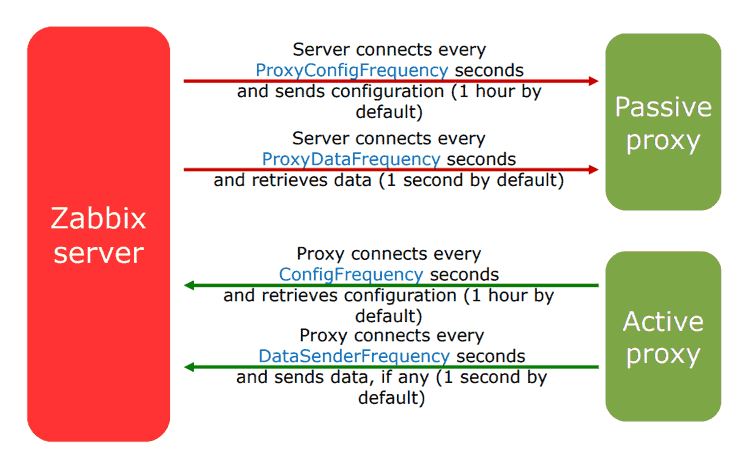
When you use a proxy in active mode, it will connect to the Zabbix server to retrieve configuration and send data. This is a great feature that enables active proxy server to work behind a firewall.
And if you use a proxy in passive mode Zabbix server will initiate a connection to the proxy to send configuration and retrieve data from the proxy.
Before, in this tutorial, we have configured proxy server to work in active mode. Let me show you how can you configure the proxy to work in passive mode.
Open file zabbix_proxy.conf with the command: “sudo nano /etc/zabbix/zabbix_proxy.conf” and turn on passive mode and define Zabbix server IP address by adding this anywhere in the file (change “Server” parameter to to match your Zabbix server):
ProxyMode=1
Server=10.7.44.235
I’m a DevOps/SRE/DevSecOps/Cloud Expert passionate about sharing knowledge and experiences. I am working at Cotocus. I blog tech insights at DevOps School, travel stories at Holiday Landmark, stock market tips at Stocks Mantra, health and fitness guidance at My Medic Plus, product reviews at I reviewed , and SEO strategies at Wizbrand.
Do you want to learn Quantum Computing?
Please find my social handles as below;
Rajesh Kumar Personal Website
Rajesh Kumar at YOUTUBE
Rajesh Kumar at INSTAGRAM
Rajesh Kumar at X
Rajesh Kumar at FACEBOOK
Rajesh Kumar at LINKEDIN
Rajesh Kumar at PINTEREST
Rajesh Kumar at QUORA
Rajesh Kumar at WIZBRAND

