Here’s a presentation of some common and effective Root Cause Analysis (RCA) tools, visually illustrated for clarity:
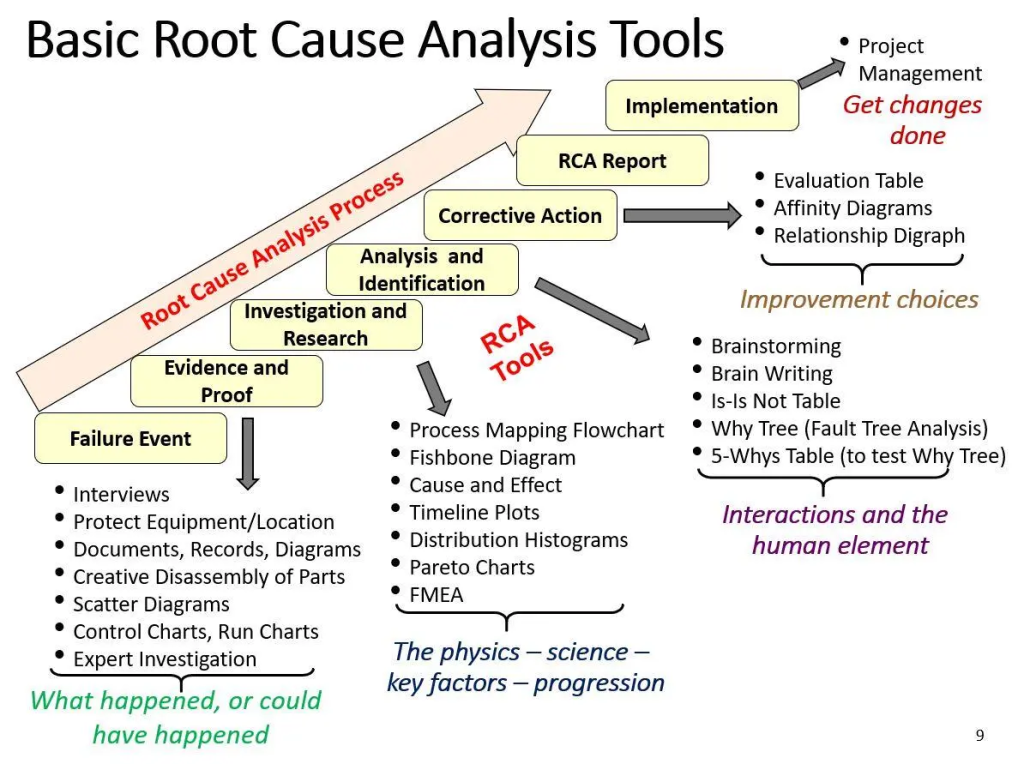
1. 5 Whys:
- Description: Repeatedly ask “why?” (frequently 5 times) to unhide the root cause beneath a problem’s surface.
2. Fishbone Diagram (Ishikawa Diagram):
- Description: Visually categorize potential causes into branches like machines, methods, materials, people, and environment.
3. Pareto Chart:
- Description: A bar graph prioritizing the most significant causes based on frequency or cost.
4. Failure Mode and Effects Analysis (FMEA):
- Description: Proactively identify potential failure modes, their causes, and potential effects.
5. Fault Tree Analysis (FTA):
- Description: Visualize the logical relationships between events leading to system failure.
6. Scatter Diagram:
- Description: Graph the relationship between two variables to uncover potential correlations and root causes.
7. Current Reality Tree (CRT):
- Description: (Theory of Constraints) Analyze complex systems to identify the underlying cause of undesirable events.
Choosing the Right RCA Tool:
The optimal tool depends on:
- Problem complexity: Simple or intricate?
- Available data: Type of data to analyze?
- Team expertise: Familiarity with RCA tools?
- Resources: Time and budget for the process?

👤 About the Author
Rahul is passionate about DevOps, DevSecOps, SRE, MLOps, and AiOps. Driven by a love for innovation and continuous improvement, Rahul enjoys helping engineers and organizations embrace automation, reliability, and intelligent IT operations. Connect with Rahul and stay up-to-date with the latest in tech!
🌐 Connect with Rahul
-
Website: MotoShare.in
-
Facebook: facebook.com/DevOpsSchool
-
X (Twitter): x.com/DevOpsSchools
-
LinkedIn: linkedin.com/company/devopsschool
-
YouTube: youtube.com/@TheDevOpsSchool
-
Instagram: instagram.com/devopsschool
-
Quora: devopsschool.quora.com
-
Email: contact@devopsschool.com
