What is MicroStrategy?

MicroStrategy is a business intelligence (BI) and analytics platform that provides organizations with tools to analyze and visualize data, make informed decisions, and drive business growth. It offers a comprehensive suite of features for data discovery, data visualization, reporting, and more.
Top 10 use cases of MicroStrategy:
Here are the top 10 use cases of MicroStrategy:
- Enterprise Reporting: MicroStrategy allows organizations to create comprehensive and dynamic reports that cover various business functions and provide insights into operational performance, financial metrics, and more.
- Data Visualization: Users can create interactive visualizations, charts, graphs, and dashboards to represent complex data in a comprehensible and visually appealing manner.
- Self-Service BI: MicroStrategy supports self-service analytics, enabling business users to access and analyze data without IT intervention. This empowers users to answer their own questions and make data-driven decisions.
- Mobile Analytics: MicroStrategy offers mobile applications that allow users to access reports and dashboards on smartphones and tablets, ensuring data accessibility and insights on the go.
- Data Exploration: With MicroStrategy, users can drill down into data, perform ad-hoc analysis, and interact with visualizations to discover hidden insights and trends within their data.
- Predictive Analytics: MicroStrategy integrates with external predictive analytics tools and allows users to apply advanced statistical models to their data for forecasting, trend analysis, and predictive modeling.
- Dashboard Creation: Organizations can create interactive dashboards that consolidate multiple visualizations into a single view, providing a holistic perspective on key performance indicators (KPIs).
- Operational Monitoring: MicroStrategy helps organizations monitor real-time operational metrics, enabling timely decision-making and proactive management of business processes.
- Financial Analysis: MicroStrategy can be used for financial analysis, including budgeting, forecasting, variance analysis, and other financial reporting needs.
- Customer Analytics: Organizations can analyze customer behavior, preferences, and engagement patterns using MicroStrategy to optimize marketing strategies and enhance customer satisfaction.
These use cases showcase MicroStrategy’s capabilities in helping organizations extract insights from their data, optimize business processes, and enhance decision-making across various business functions.
What are the feature of MicroStrategy?

MicroStrategy is a powerful business intelligence and analytics platform that offers a wide range of features for data discovery, visualization, reporting, and more. It is designed to help organizations gather insights from their data and make informed decisions. Here are some key features of MicroStrategy:
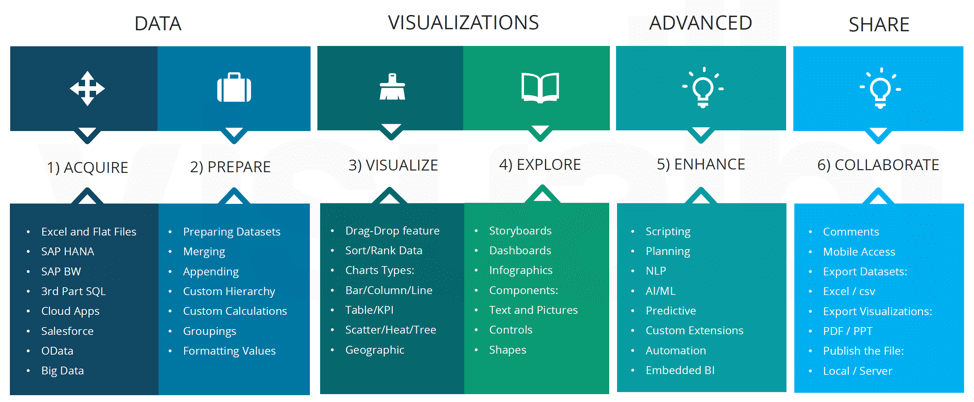
- Data Connectivity: MicroStrategy supports connectivity to various data sources, including databases, spreadsheets, cloud services, and big data sources. It can integrate with both structured and unstructured data.
- Data Preparation and Transformation: MicroStrategy provides data preparation capabilities, allowing users to cleanse, transform, and manipulate data before analysis. Users can create derived metrics, calculated attributes, and custom hierarchies.
- Data Discovery: MicroStrategy allows users to explore and discover patterns, trends, and relationships in their data. Ad-hoc querying and interactive visualizations support exploratory analysis.
- Data Visualization: The platform offers a wide range of interactive visualization options, including charts, graphs, maps, and heat maps. Users can customize visualizations to meet their reporting needs.
- Self-Service BI: MicroStrategy empowers business users to create their own reports, dashboards, and analyses without relying on IT. Self-service features promote data-driven decision-making.
- Mobile Analytics: MicroStrategy provides responsive design and native mobile applications, enabling users to access and interact with reports and dashboards on smartphones and tablets.
- Predictive Analytics Integration: MicroStrategy can integrate with third-party predictive analytics tools and algorithms, allowing users to apply advanced analytics techniques to their data.
- Enterprise Reporting: MicroStrategy supports the creation of pixel-perfect enterprise reports with rich formatting, calculations, and pagination controls.
- Operational Dashboards: MicroStrategy enables the creation of interactive and real-time operational dashboards that monitor key metrics and help manage business processes.
- Collaboration and Sharing: MicroStrategy allows users to collaborate on reports and dashboards, share insights with colleagues, and provide annotations and comments within the platform.
- Security and Governance: MicroStrategy offers robust security features, including role-based access control, data encryption, and audit logs. Administrators can define data access and user privileges.
How MicroStrategy works and Architecture?

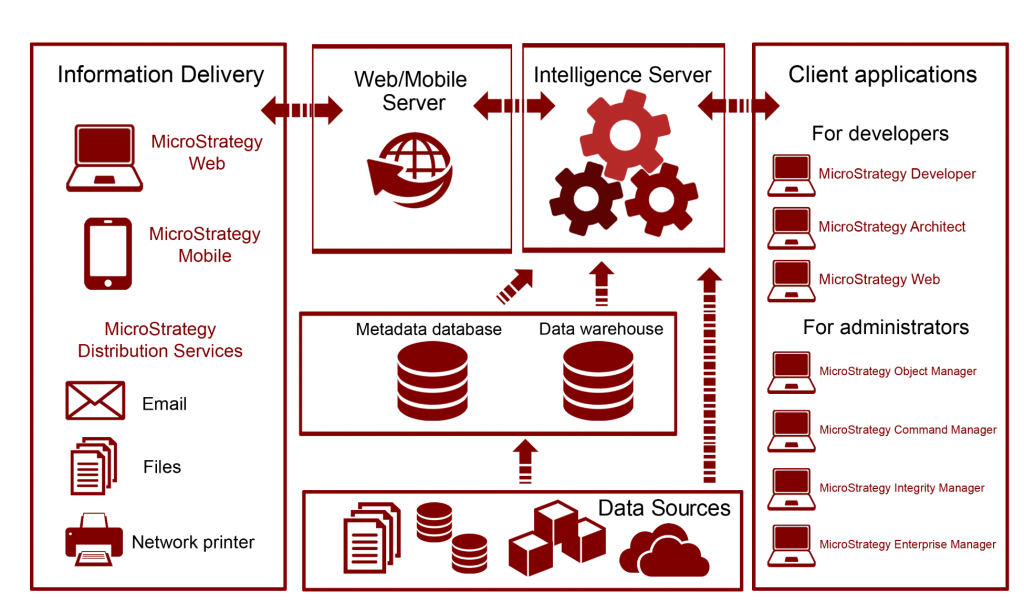
MicroStrategy’s architecture is designed to provide scalable and high-performance analytics capabilities. Here’s an overview of its architecture:
- Data Sources: MicroStrategy can connect to various data sources, including databases, data warehouses, cloud services, and big data platforms.
- MicroStrategy Web: MicroStrategy Web is the user interface for accessing and interacting with reports, dashboards, and analytics. It supports web browsers and mobile devices.
- MicroStrategy Mobile: MicroStrategy Mobile provides native mobile applications for accessing and interacting with reports and dashboards on smartphones and tablets.
- Metadata Repository: The metadata repository stores information about reports, dashboards, data connections, security settings, and user profiles.
- Intelligence Server: The Intelligence Server processes user requests, generates queries, retrieves data from data sources, and manages security and user authentication.
- Data Warehouse: MicroStrategy can leverage data warehouses as the source of data, allowing for optimized performance and data governance.
- Data Transformation and ETL: Data transformation and ETL processes can be performed using external tools or integrated solutions.
- Analytical Engine: The Analytical Engine processes calculations, aggregations, and other analytical operations required for reports and dashboards.
- Security Services: Security services control user authentication, role-based access, and data encryption to ensure data protection and governance.
- MicroStrategy Developer: MicroStrategy Developer is used to design and create reports, dashboards, and data models. It provides a visual interface for designing data objects and visualizations.
Overall, MicroStrategy’s architecture is designed to provide a seamless and comprehensive platform for data analysis, visualization, and reporting, catering to both end-users and IT administrators.
How to Install MicroStrategy?
There are two ways to install MicroStrategy:
- Using the MicroStrategy installer:
- Go to the MicroStrategy website and download the MicroStrategy installer for your operating system.
- Run the installer and utilize the given instructions on the screen.
- Using the MicroStrategy virtual appliance:
- Go to the MicroStrategy website and create a MicroStrategy account.
- Subscribe to MicroStrategy.
- Once you have subscribed to MicroStrategy, you will be able to download the MicroStrategy virtual appliance.
Once you have installed MicroStrategy, you can start creating reports and dashboards.
Here are the detailed steps on how to install MicroStrategy using the MicroStrategy installer:
- Go to the MicroStrategy website and download the MicroStrategy installer for your operating system.
- Run the installer and utilize the given instructions on the screen.
- On the first screen, accept the terms of the license agreement and click Next.
- On the second screen, select the installation options that you want and click Next.
- On the third screen, select the folder where you want to install MicroStrategy and click Install.
- The installer will start installing MicroStrategy. This may take a few minutes.
- Once the installation is complete, click Finish.
Once you have installed MicroStrategy, you can start creating reports and dashboards.
Here are the detailed steps on how to install MicroStrategy using the MicroStrategy virtual appliance:
- Go to the MicroStrategy website and create a MicroStrategy account.
- Subscribe to MicroStrategy.
- Once you have subscribed to MicroStrategy, you will be able to download the MicroStrategy virtual appliance.
Once you have downloaded the MicroStrategy virtual appliance, follow these steps to install it:
- Unzip the MicroStrategy virtual appliance file.
- Open the VirtualBox application.
- Hit on the File menu and choose Import Appliance….
- In the Import Appliance dialog box, select the MicroStrategy virtual appliance file that you unzipped in step 1.
- Click on the Open button.
- The MicroStrategy virtual appliance will be imported into VirtualBox.
- Click on the Start button to start the MicroStrategy virtual appliance.
- The MicroStrategy virtual appliance will start up and you will be prompted to log in.
- Log in using the username and password that you created when you subscribed to MicroStrategy.
- Once you have logged in, you will be able to access MicroStrategy.
Basic Tutorials of MicroStrategy: Getting Started

The following steps are the basic tutorials of MicroStrategy:
- Getting Started with MicroStrategy: This tutorial shows you how to install MicroStrategy, create a new project, and create a report.
- Go to the MicroStrategy website and download the MicroStrategy installer for your operating system.
- Run the installer and utilize the given instructions on the screen.
- Once you have installed MicroStrategy, open the MicroStrategy Desktop application.
- Click on the New button.
- Select the Project option.
- Click on the Create button.
- In the Project Name dialog box, enter a name for your project and click on the OK button.
- In the Project Wizard, select the data source that you want to use.
- Click on the Next button.
- In the Fields page, select the fields that you want to add to your report.
- Click on the Next button.
- In the Layout page, choose a layout for your report.
- Click on the Next button.
- In the Visualizations page, add a visualization to your report.
- Click on the Finish button.
- Connecting to Data in MicroStrategy: This tutorial shows you how to connect to different data sources in MicroStrategy.
- MicroStrategy may connect to a broad variety of data sources, including:
- Microsoft Excel spreadsheets
- Microsoft SQL Server databases
- Cloud-based data sources such as Azure Data Lake Storage and Amazon Redshift
- To connect to a data source, you can use the Data Sources dialog box.
- In the Data Sources dialog box, right-click on the Data Sources node and select New Data Source.
- In the New Data Source dialog box, select the data source type that you want to connect to.
- Enter the connection details.
- Click on the OK button.
- MicroStrategy may connect to a broad variety of data sources, including:
- Creating Visualizations in MicroStrategy: This tutorial shows you how to create different visualizations in MicroStrategy.
- MicroStrategy provides a wide variety of visualizations that you can use to represent your data.
- Some of the visualizations that you can create in MicroStrategy include:
- Bar charts
- Line charts
- Pie charts
- Maps
- To create a visualization, you can use the Visualizations pane.
- In the Visualizations pane, drag and drop the visualization type that you want to create to the Canvas pane.
- You may then configure the visualization.
- Creating Dashboards in MicroStrategy: This tutorial shows you how to create dashboards in MicroStrategy.
- A dashboard is a group of visualizations that you may apply to monitor your data.
- You may generate different dashboards for different purposes, such as:
- A dashboard for tracking sales performance
- A dashboard for monitoring customer satisfaction
- A dashboard for tracking inventory levels
- To create a dashboard, you can use the Dashboards pane.
- In the Dashboards pane, drag and drop the visualizations that you want to include in the dashboard to the Canvas pane.
- You can then configure the dashboard.

👤 About the Author
Ashwani is passionate about DevOps, DevSecOps, SRE, MLOps, and AiOps, with a strong drive to simplify and scale modern IT operations. Through continuous learning and sharing, Ashwani helps organizations and engineers adopt best practices for automation, security, reliability, and AI-driven operations.
🌐 Connect & Follow:
- Website: WizBrand.com
- Facebook: facebook.com/DevOpsSchool
- X (Twitter): x.com/DevOpsSchools
- LinkedIn: linkedin.com/company/devopsschool
- YouTube: youtube.com/@TheDevOpsSchool
- Instagram: instagram.com/devopsschool
- Quora: devopsschool.quora.com
- Email– contact@devopsschool.com

