What is SAP BusinessObjects?

SAP BusinessObjects is a suite of business intelligence (BI) and analytics tools developed by SAP. It offers a range of solutions that help organizations gather, analyze, and visualize data, enabling data-driven decision-making. SAP BusinessObjects is known for its comprehensive set of tools that cover various aspects of business intelligence and reporting.
Top 10 use cases of SAP BusinessObjects:
Here are the top 10 use cases of SAP BusinessObjects:
- Enterprise Reporting: SAP BusinessObjects provides a platform for creating and distributing enterprise-level reports that cover various business functions, such as finance, sales, HR, and more.
- Data Visualization: Users can create interactive visualizations, charts, and graphs to present data insights in a compelling manner. SAP BusinessObjects offers a variety of visualization options.
- Dashboard Creation: Organizations can build dynamic dashboards that consolidate multiple visual elements, such as reports and charts, into a single view. This helps in providing a quick overview of key performance indicators (KPIs).
- Ad-Hoc Reporting: Users can create on-the-fly reports to answer specific business questions. SAP BusinessObjects provides tools for ad-hoc querying and report generation.
- Self-Service BI: SAP BusinessObjects supports self-service BI, allowing business users to access and analyze data independently, reducing the dependency on IT for generating reports.
- Data Exploration: With SAP BusinessObjects, users can explore data, drill down into details, and filter data to uncover insights and patterns within datasets.
- Mobile Analytics: SAP BusinessObjects offers mobile applications that allow users to access and interact with reports and dashboards on smartphones and tablets.
- Predictive Analytics: The suite includes advanced analytics capabilities that enable users to perform predictive modeling, forecasting, and trend analysis on their data.
- Operational Monitoring: Organizations can monitor real-time data and operational metrics using SAP BusinessObjects. This is particularly useful for tracking real-time business processes.
- Data Governance and Security: SAP BusinessObjects provides features for managing data governance, ensuring data quality, and implementing security measures to control access to sensitive information.
These use cases showcase the versatility of SAP BusinessObjects in enabling organizations to gain insights from their data, enhance decision-making processes, and streamline reporting and analytics across various business functions.
What are the feature of SAP BusinessObjects?

SAP BusinessObjects offers a wide range of features for business intelligence (BI) and reporting. These features help organizations gather, analyze, and visualize data, making informed decisions and improving business processes. Here are some of the key features of SAP BusinessObjects:
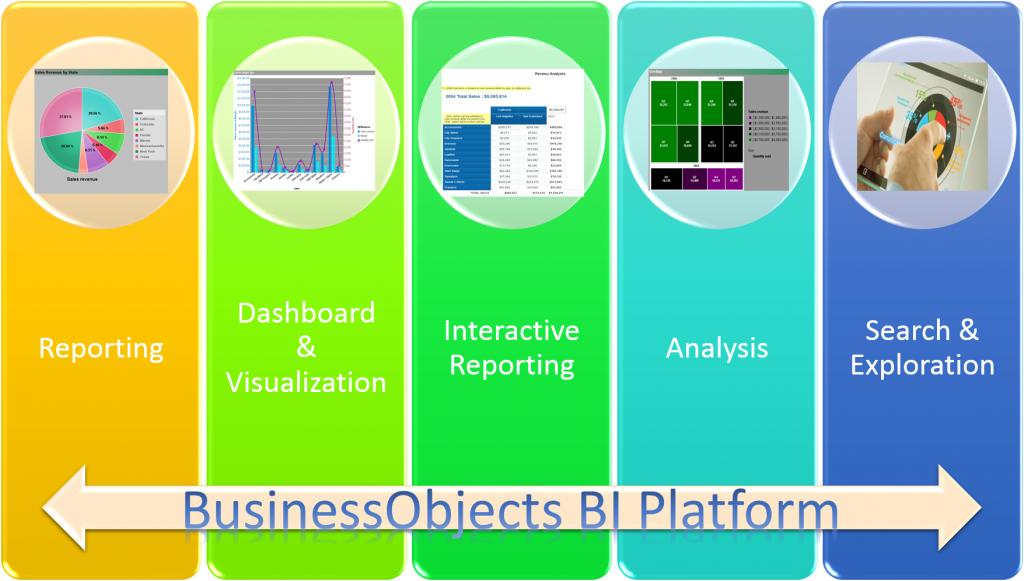
- Reporting and Analysis: SAP BusinessObjects provides tools for creating ad-hoc reports, interactive dashboards, and detailed analyses. Users can visualize data using charts, graphs, and tables.
- Data Visualization: The suite offers various visualization options, including geospatial maps, charts, graphs, and more, helping users understand trends, patterns, and outliers in their data.
- Self-Service BI: SAP BusinessObjects empowers business users to access and analyze data independently, allowing them to create reports and dashboards tailored to their needs without relying on IT.
- Data Connectivity: It supports connectivity to various data sources, including databases, spreadsheets, and web services, allowing users to gather data from different systems.
- Mobile Analytics: SAP BusinessObjects offers mobile applications that enable users to access reports and dashboards on mobile devices, ensuring data accessibility on the go.
- Data Exploration: Users can drill down into data, apply filters, and perform ad-hoc analysis to gain deeper insights and explore data relationships.
- Predictive Analytics: The suite includes predictive capabilities, allowing users to apply statistical models, forecasting, and predictive algorithms to their data.
- Operational Monitoring: SAP BusinessObjects enables real-time monitoring of operational metrics, helping organizations track and manage their business processes in real time.
- Data Governance and Security: The suite offers tools for data governance, quality management, and security. Administrators can define user roles, permissions, and data access policies.
- Integration with SAP and Non-SAP Systems: SAP BusinessObjects can integrate with both SAP and non-SAP systems, allowing users to access data from various sources and create unified reports and analyses.
How SAP BusinessObjects works and Architecture?

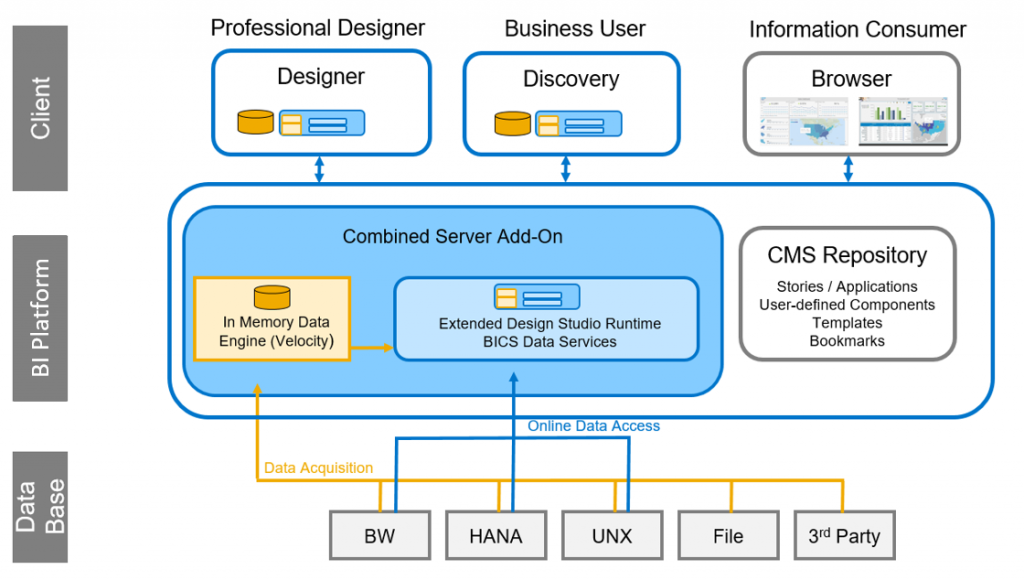
The architecture of SAP BusinessObjects is designed to support various components and services required for business intelligence and reporting. Here’s an overview of its architecture:
- Data Sources: SAP BusinessObjects can connect to different data sources, such as databases, spreadsheets, and data warehouses.
- Data Integration: Data from various sources is extracted, transformed, and loaded into a central repository using tools like SAP BusinessObjects Data Services or other ETL (Extract, Transform, Load) solutions.
- Central Repository: The central repository stores metadata, reports, dashboards, and other objects. It helps ensure consistency and allows for sharing and reuse of content.
- Report and Dashboard Creation: Users create reports and dashboards using tools like SAP Web Intelligence, SAP Crystal Reports, and SAP Lumira Designer.
- Web Application Server: The web application server hosts and delivers reports and dashboards to end-users through web browsers. It supports user authentication and security.
- Data Access and Querying: The Query Processing and Reporting (QPR) engine processes user queries, retrieves data from the repository, and generates reports based on predefined queries or ad-hoc requests.
- Security and Access Control: The security framework ensures controlled access to reports, dashboards, and data, with role-based permissions and authentication mechanisms.
- User Interfaces: Users access and interact with reports, dashboards, and analyses through web-based interfaces and mobile applications.
- Mobile App Server: The mobile app server hosts and delivers reports and dashboards to mobile devices via mobile applications.
- Integration with Other Systems: SAP BusinessObjects integrates with other SAP applications, databases, and systems to access data and provide a unified view of information.
Overall, the architecture of SAP BusinessObjects is designed to facilitate data access, reporting, and analysis across the organization, ensuring data accuracy, security, and accessibility.
How to Install SAP BusinessObjects?
There are two ways to install SAP BusinessObjects:
- Using the SAP BusinessObjects installer:
- Go to the SAP website and download the SAP BusinessObjects installer for your operating system.
- Run the installer and use the given instructions over the screen.
- Using the SAP BusinessObjects subscription:
- Go to the SAP website and create a SAP account.
- Subscribe to SAP BusinessObjects.
- Once you have subscribed to SAP BusinessObjects, you will be able to download the SAP BusinessObjects installer.
Once you have installed SAP BusinessObjects, you can start creating reports and dashboards.
Here are the detailed steps on how to install SAP BusinessObjects using the SAP BusinessObjects installer:
- Go to the SAP website and download the SAP BusinessObjects installer for your operating system.
- Run the installer and use the given instructions over the screen.
- On the first screen, accept the terms of the license agreement and click Next.
- On the second screen, select the installation options that you want and click Next.
- On the third screen, select the folder where you want to install SAP BusinessObjects and click Install.
- The installer will start installing SAP BusinessObjects. This may take a few minutes.
- Once the installation is complete, click Finish.
Once you have installed SAP BusinessObjects, you can start creating reports and dashboards.
Here are the detailed steps on how to install SAP BusinessObjects using the SAP BusinessObjects subscription:
- Go to the SAP website and create a SAP account.
- Subscribe to SAP BusinessObjects.
- Once you have subscribed to SAP BusinessObjects, you will be able to download the SAP BusinessObjects installer.
Once you have downloaded the SAP BusinessObjects installer, run it and follow the on-screen instructions to install SAP BusinessObjects.
Once you have installed SAP BusinessObjects, you can start creating reports and dashboards.
Basic Tutorials of SAP BusinessObjects: Getting Started

Here are some basic tutorials of SAP BusinessObjects:
- Getting Started with SAP BusinessObjects: This tutorial shows you how to install SAP BusinessObjects, create a new report, and add a visualization.
- Go to the SAP website and download the SAP BusinessObjects installer for your operating system.
- Run the installer and apply the given instructions over the screen.
- Once you have installed SAP BusinessObjects, open the SAP BusinessObjects Explorer.
- Click on the New button.
- Select the Report option.
- Click on the Create button.
- In the Report Wizard, select the data source that you want to use.
- Click on the Next button.
- In the Fields page, select the fields that you want to add to your report.
- Click on the Next button.
- In the Layout page, choose a layout for your report.
- Click on the Next button.
- In the Visualizations page, add a visualization to your report.
- Click on the Finish button.
- Connecting to Data in SAP BusinessObjects: This tutorial shows you how to connect to different data sources in SAP BusinessObjects.
- SAP BusinessObjects can connect to a wide variety of data sources, including:
- Microsoft Excel spreadsheets
- Microsoft SQL Server databases
- Cloud-based data sources such as Azure Data Lake Storage and Amazon Redshift
- To connect to a data source, you can use the Data Source Explorer.
- In the Data Source Explorer, right-click on the Data Sources node and select New Data Source.
- In the New Data Source dialog box, select the data source type that you want to connect to.
- Enter the connection details.
- Click on the OK button.
- SAP BusinessObjects can connect to a wide variety of data sources, including:
- Creating Visualizations in SAP BusinessObjects: This tutorial shows you how to create different visualizations in SAP BusinessObjects.
- SAP BusinessObjects provides a wide variety of visualizations that you can use to represent your data.
- Some of the visualizations that you can create in SAP BusinessObjects include:
- Bar charts
- Line charts
- Pie charts
- Maps
- To create a visualization, you can use the Visualization Wizard.
- In the Visualization Wizard, select the visualization type that you want to create.
- Select the fields that you want to use in the visualization.
- Configure the visualization.
- Click on the Finish button.
- Creating Dashboards in SAP BusinessObjects: This tutorial shows you how to create dashboards in SAP BusinessObjects.
- A dashboard is a bunch of visualizations that you can apply to monitor your data.
- You can create different dashboards for different purposes, such as:
- A dashboard for tracking sales performance
- A dashboard for monitoring customer satisfaction
- A dashboard for tracking inventory levels
- To create a dashboard, you can use the Dashboard Wizard.
- In the Dashboard Wizard, select the visualizations that you want to include in the dashboard.
- Configure the dashboard.
- Click on the Finish button.

👤 About the Author
Ashwani is passionate about DevOps, DevSecOps, SRE, MLOps, and AiOps, with a strong drive to simplify and scale modern IT operations. Through continuous learning and sharing, Ashwani helps organizations and engineers adopt best practices for automation, security, reliability, and AI-driven operations.
🌐 Connect & Follow:
- Website: WizBrand.com
- Facebook: facebook.com/DevOpsSchool
- X (Twitter): x.com/DevOpsSchools
- LinkedIn: linkedin.com/company/devopsschool
- YouTube: youtube.com/@TheDevOpsSchool
- Instagram: instagram.com/devopsschool
- Quora: devopsschool.quora.com
- Email– contact@devopsschool.com

